Abstract
We analyzed displacement by natural disasters and consequences for well-being among individuals ages 65 and older, interviewed between September 2023 and September 2024 in the nationally representative, high-frequency U.S. Census Bureau Household Pulse Survey. Approximately 1.2% of the U.S. older adult population (an estimated 635,000 people) reported displacement over a 1-year period, with increasing rates by age and significant differences in odds of displacement by race, education level, and income. Following displacement, a majority experienced electricity shortage, fear of crime, and scam attempts. This highlights older Americans’ vulnerability to natural disasters and unveils important disparities within this growing population.
Key Words
natural disasters, displacement, older Americans, inequality, Household Pulse Survey
Since 1980 there has been an average of 9 billion-dollar disasters per year in the United States (Jay et al., 2023). But in the past 5 years (2020–2024), this number has climbed to 23 billion-dollar disasters each year (Smith, 2025). Natural disasters are widespread in the United States: In the past 50 years, 90% of counties have experienced a disaster (Connor, 2025). Regions vary in their vulnerability to types of disasters (e.g., some are more prone to fires or hurricanes than others), so while the occurrence of disasters is widespread, disaster impacts tend to be concentrated locally. For example, the Palisades Fire in early 2025 displaced tens of thousands in just one part of Los Angeles (Phillips, 2025). Furthermore, disaster exposure as well as recovery may vary by the social vulnerability of impacted areas (Choi et al., 2025; Waters et al., 2024).
Older adults live throughout the United States, but some regions—particularly states that attract retirees and rural areas that have seen outmigration of younger populations (Brooks et al., 2010)—have higher shares of populations older than age 65 (Aguirre‐Torres et al., 2024). Age is a known risk factor for negative disaster consequences (Tipaldo et al., 2024; Zuelsdorff & Limaye, 2024).
While we don’t know whether there’s a disproportionate number of older adults living in disaster-prone regions, we do know that some states at high risk of tropical storms and sea-level rise (e.g., Florida) have older-than-average populations, and that the proportion of older adults is growing faster in cities in low-lying coastal areas than in cities farther from the coast and/or at higher elevation (Tagtachian & Balk, 2023). Many older adults’ biggest financial asset is their house, meaning damage to or displacement from their home will be devastating (Goodman et al., 2024).
Migration and displacement after disasters: What is known in general vs. among older adults?
Studies of major tropical storms in the United States (Hurricane Katrina, Superstorm Sandy) investigated out- and return-migration patterns of affected populations (Curtis et al., 2015; Fussell & Castro, 2022), yet few of those studies specifically tracked older adults (Bukvic et al., 2018; Merdjanoff et al., 2019). A study of all ages, using the U.S. Census Bureau Household Pulse Survey (HPS)for 2023, found that approximately 1.5% of the U.S. population reported displacement from their home due to a disaster in the past year, with disparities by race, gender/sexuality, income, and disability status and with variation in length of displacement for different disaster types (Aung & Sehgal, 2024).
In this article, we present new estimates on the number of older Americans affected by natural disasters and their characteristics. Using the nationally representative sample from rapid-response/fast-turnaround Household Pulse Survey (HPS), we document the prevalence and vulnerability of adults ages 65 and older to disaster displacement (U.S. Census Bureau, 2024b, 2025). The HPS is a novel Census Survey project that collects data on various aspects of life among U.S. households, including displacement due to natural disasters. We investigate who is at risk of becoming displaced by disasters, and the role played by socioeconomic background characteristics (age, educational attainment, race/ethnicity) and contemporaneous factors (household income). We also look at the type of disaster experienced and its impact among those who were displaced in the past year, and respondents provided insight into subsequent impacts, such as being without electricity or being scammed in the month after a disaster.
Data and Methods
Statistical analyses for this study used individual-level data from 11 cycles (rounds of data collection) of the HPS spanning Sept. 20, 2023, to Sept. 16, 2024 (specifically Phase 3, Weeks 62 & 63 and all of Phase 4). As of Sept. 16, 2024, the HPS has undergone changes and field implementations due to catastrophic disasters that happened in late 2024. As a result, the 2024 data utilized were from prior to September.
‘We investigate who is at risk of becoming displaced by disasters, and the role played by socioeconomic background characteristics (age, educational attainment, race/ethnicity) and contemporaneous factors (household income).’
The nationally representative HPS provides a unique window into the lives of older adults affected by natural disasters. The questions examined for this study comprise two main categories: 1) Displacement status (whether a respondent reported being displaced within a year prior to responding to the survey, by which disasters they were displaced, how long they were displaced), and 2) Vulnerabilities faced after displacement to disasters (property damage, shortage of food/drinking water, feelings of isolation and other mental health impacts, etc.). We paired these questions with those on the respondents’ self-reported demographic variables.
Demographic variables examined in this study include race/ethnicity, age group, gender (sex at birth), household income level, and education. Age was calculated by subtracting year of birth (top-coded at 1936) from 2024. Age was simplified into categorical groups: 65–74, 75–84, and 85 and older. The categorical household income answers were combined based on 2023 American Community Survey estimates to become: <$35k, $35k–$75k, $75k–$150k, >$150k (U.S. Census Bureau, 2023). Variables of birth year, race, education, and sex at birth were imputed by the Census Bureau prior to data release; for income, we analyzed separately people who did not report their income. (Following the technical documentation [U.S. Census Bureau, 2024b], we applied the necessary “survey weights” so that the sample is representative of the national population.)
In the results that follow, unless otherwise noted, visualizations omit respondents who did not answer questions about displacement status or about specific impacts.
Analytical Approach
We estimated how many Americans ages 65 and older nationwide were displaced by disasters in an approximately 1-year period, which socioeconomic groups within this population faced a greater risk of becoming displaced, and how displacement affected their quality of life.
The analysis proceeds in three steps, reporting:
- The average annual number and incidence of older individuals displaced by disasters (overall and by type of disaster) in the United States, using weighted descriptive statistics.
- Evidence from logistic regressions (on all adults ages 65 and older) on which socioeconomic characteristics are associated with elevated risk of experiencing displacement at older ages from multivariate analyses.
- Estimates, among older individuals who experienced displacement, of how long they were displaced and severity of economic loss they suffered, as well as how commonly they experienced shortages in essentials such as food and water, were subject to unsanitary living conditions, or experienced a mental health crisis in the month following the disaster. For this in-depth view, we used a variety of methods, described below.
Results
The sample size from the 11 cycles was n = 235,189, which when weighted was 59,808,265 U.S. adults ages 65 or older. A sizeable number of older individuals experience displacement by natural disasters, with important socioeconomics disparities in who is at risk. We estimate that, on average, about 1.2% (95% Confidence Interval [CI]: 1.1%–1.3%) of the population ages 65 and older in the United States are displaced due to a disaster per year, or approximately 635,000 individuals ages 65 and older. (Technical note: 95% CIs are standard ways of indicating the likely range of values around the calculated estimate based on the survey sample and design. To get a good representation of the country, survey respondents are selected in a complex way.)
People ages 85 and older are more likely to report displacement due to all disaster types (hurricane, tornado, flood, fire, other, and multiple of these).
This count is likely an underestimate because, for example, the weighted frequency count does not include those who did not answer this question (11% of participants) and because people displaced due to disasters might be less likely to respond to a survey, if, for instance, they had no electricity.
Figure 1 (below) shows the distribution of disaster type of individuals ages 65 and older who were displaced by state (in the pie-chart map). It also illustrates the age distribution of individuals ages 65 and older, broken down by type of disaster that caused their displacement, with the 10 most impacted (and median) states listed. People ages 85 and older are more likely to report displacement due to all disaster types (hurricane, tornado, flood, fire, other, and multiple of these), relative to their share in the population. Among those reporting displacement due to multiple disasters, a disproportionate share of the oldest adults was impacted (41.2%).
In contrast, when compared to the general population ages 65 and older (those displaced as well as not displaced), the share of 65- to 74-year-olds looks similar for all disaster types except flooding, where they are more heavily represented, and multiple or “other” disasters where their share is smaller. (Documentation in the HPS does not indicate which disasters were classified as “other.”)
These proportions and the leading disaster type vary by state—with Louisiana (3.8%), Florida (3.1%), Texas (2.0%), and Hawaii (2.0%) reporting much higher displacement rates of older adults in our study period. Fires were the most common disaster reported in Hawaii and hurricanes and multiple disasters were the two leading causes reported in Louisiana, Florida, and Texas.
Figure 1. Proportion of adults ages 65 and older who reported being displaced due to a natural disaster within the past year (bar chart), and distribution of disaster displacement of older adults by type of disaster and state (pie-chart map) with top-ten states listed with overall level of displacement.
Source: Authors’ calculations based on HPS September 2023–September 2024.
Figure 2 (below) shows the adjusted odd ratios (OR) of displacement among older adults in a given 12-month period and corresponding 95% CI for a set of key demographic and economic characteristics. All patterns discussed below are statistically significant.
Looking at the factors predicting who among older adults experiences displacement (controlling for the other factors shown), we find that the oldest old (ages 85 and older) were at highest risk, at 4 times the odds compared to the reference group (ages 65–74). (There is no statistically significant difference in displacement risk between the 65–74 and 75–84 age brackets.)
Looking at race and ethnicity differences, the odds of being displaced are significantly (OR: 2.2, CI: 1.7–2.9) greater among Hispanics or Latinos than among whites. Individuals who identified as other/multiple race group face the second highest displacement risk, with significantly (OR: 1.8, CI: 1.3–2.5) greater odds of displacement relative to whites. Among non-Hispanic Blacks displacement odds are significantly (OR: 1.6, CI: 1.2–2.0) higher compared to whites. These disparities highlight the disproportionate impact of disasters on marginalized communities.
When it comes to household income (measured as total income from all sources, but not savings or wealth) there is a U-shape distribution: Individuals in households earning less than $35,000 a year were more likely to be displaced than higher income individuals ($150,000+), along with those who did not report income, and middle-income individuals were less likely to report displacement. Specifically, the odds of displacement for individuals in the lowest income group are significantly greater (OR: 1.6, 95% CI: 1.3–2.0) compared to individuals in households with incomes ranging from $75,000 to $149,999. The displacement odds among top earners are significantly greater (OR: 1.5, CI: 1.1–2.2) than middle-income individuals ($75,000 to $149,999).
We also found that those with the lowest level of formal schooling (no high school education) are significantly more likely to experience displacement than those with a high school diploma (OR: 2.6, CI: 1.9–3.6). There is evidence that having more formal schooling is also associated with greater displacement risk, but the estimated magnitudes of the odds ratios suggest the differences are less pronounced with significantly greater odds for those with some college/associate degree and significantly greater odds for bachelor’s degree holders, relative to those with only a high school diploma.
The U-shaped relationships between measures of socioeconomic status (income and education) and displacement are consistent with findings that low- and middle-income homeowners exhibited lower resiliency than poorer renters in the aftermath of Superstorm Sandy in New York (Madajewicz, 2020). This finding also likely reflects underlying mechanisms whereby wealthier individuals have options on where to move or relocate after disasters whereas poor individuals—almost always renters and possibly in lower quality housing—may be required to move.
Figure 2. Number displaced, by demographic characteristics and with adjusted odds ratios of displacement.
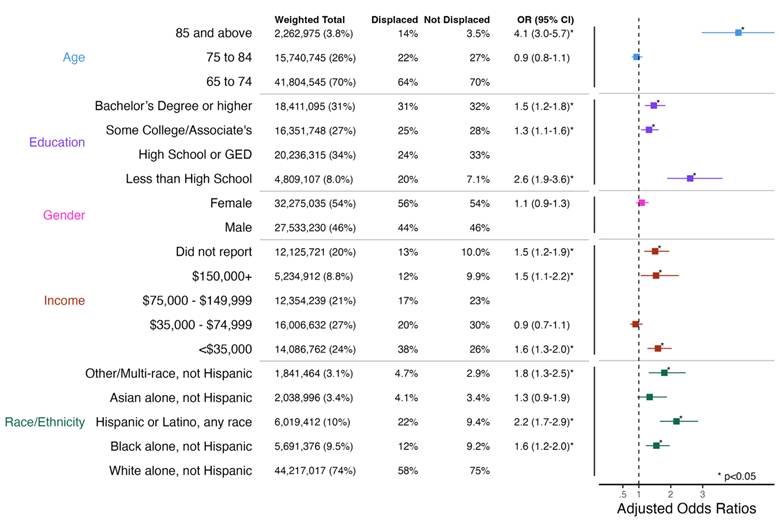
Source: Authors’ calculations based on HPS September 2023–September 2024 (model sample size: n = 213,031).
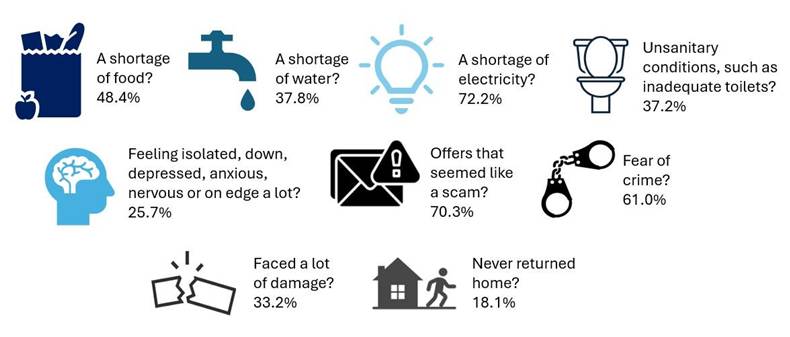
Figure 3, below, shows the experiences of individuals ages 65 and older who were displaced by disasters, focusing on impacts. More than 70% reported being without electricity. Similarly, 37.2% (95% CI: 32.5–42.2) faced unsanitary conditions such as inadequate toilets, nearly half (48.4%; 95% CI: 44.3–52.6) reported a shortage of food, and more than a third (37.8%; 95% CI: 34.2–41.6) reported a shortage of water during the first month after the disaster struck.
In addition to these negative impacts on basic needs, there is evidence of substantial psychological impacts. One in four (25.7%; 95% CI: 22.0–29.6) displaced older respondents reported feeling isolated, down, depressed, anxious, nervous, or on edge “a lot.” In addition, 61.0% (95% CI: 57.3–64.5) experienced fear of being the victim of a crime, and 70.3% (95% CI: 65.7–74.4) received offers that seemed like a scam in the aftermath of the disaster. A review of some of these outcomes for the population ages 18 or older can be found in Aung and Sehgal (2024), from approximately a year earlier (December 2022–September 2023). They found that for some outcomes, older adults are much like younger ones (e.g., feeling isolated), but older adults were more likely than younger adults to face “a lot” of damage or report never returning home.
Figure 3. Proportion of older displaced individuals whose quality of life was impacted in the month following the disaster, 2023–2024.
Source: Authors’ calculations based on HPS September 2023–September 2024.
The survey asked more generally about length of displacement and extent of damage sustained. We note that the information on displacement duration is not ideal because the disaster date is unknown—that is, it could be anytime within the past year. Given this limitation, as of the survey date, 44.1% reported being displaced for less than a week, 20.4% for 1 week to 1 month, 8.1% for 1 to 6 months, 9.3% for more than 6 months, and 18.1% reported never returning home (Figure 3; 95% CI: 14.0–23.0).
Similarly, in terms of damage to property or possessions, 33.2% reported “a lot” of damage (Figure 3; 95% CI: 28.6%–38.2%), 18.0% had a “moderate amount” of damage, 25.9% reported “some” damage, and 22.8% reported “no damage.”
More than 70% of individuals ages 65 and older displaced by disasters reported being without electricity, 37.2% faced unsanitary conditions, nearly half reported a shortage of food and more than a third reported a shortage of water during the first month post-disaster.
Figure 4 shows the adjusted odds ratios among those displaced of experiencing particular disaster-related impacts: never moving back home, experiencing “a lot” of damage, feeling isolated or other mental health impacts “a lot,” and receiving offers that seemed like a scam. In contrast to Figure 2, the analysis is based upon a much smaller sample size and the broad patterns seen above are more nuanced. Nevertheless, the oldest adults have the greatest odds for all of these outcomes apart from reporting scam attempts. The lowest income older adults were more likely to report being isolated as well as scammed, whereas older adults with household incomes of $35,000–$74,999 were less likely to report isolation or other mental health impacts. The lowest income group <$35,000 were more likely to report this and also scam attempts. Among race/ethnic groups, only Hispanics reported a much higher likelihood of never returning home, but there were no other significant differences by race/ethnicity, gender, or education on any of these impacts.
Figure 4. Adjusted odds ratios of reporting selected impacts by sociodemographic characteristics.
Source: Authors’ calculations based on HPS September 2023–September 2024 (sample size per model: n = 1950, n = 1983, n = 1987, n = 1989).
Limitations
These findings are subject to several limitations. Our analysis focused on the impact of disasters in the context of being displaced. Individuals can be affected, even severely, by disasters without experiencing displacement. HPS did not ask impact-related questions of individuals who did not report displacement, a limitation of the data that we hope to see addressed in future surveys. This implies that our estimate of the annual number of older individuals affected by disasters is likely an undercount. Given their generally worse health and more accommodative housing, older adults in institutionalized settings may be less likely to become physically displaced or suffer loss of personal property, but more likely to see their quality of life impacted from disasters. This speculation requires more research comparing how disasters affect these different populations.
Another limitation of this data is its cross-sectional nature, which prevents assessment of potentially endogenous variables such as disability, housing, and living arrangements. Though rental and public housing may be at higher risk of disaster impacts, owned homes at risk may have unique challenges, such as owners being less willing or able to move (Arigoni, 2023; Madajewicz, 2020). Older adults, particularly those on fixed incomes, may face challenges obtaining or knowing about flood insurance or loans to repair damage post-disaster. In 2025, the HPS was relaunched as the Household Trends and Outlook Pulse Survey (HTOPS; U.S. Census Bureau, 2024a) with a longitudinal design that can help to address some of these shortcomings.
Conclusions
The increasing frequency and severity of disasters in the United States, exacerbated by climate change, impose substantial social and economic costs that disproportionately affect vulnerable populations, particularly older Americans. Our findings show the estimated prevalence of experiencing displacement among older adults, with increasing risks by age and disparities in impacts by income. Further, displaced people reported experiencing hardships, with most reporting loss of electricity, isolation or mental health impacts, and scam attempts, which could have implications not only for older adults’ health and safety, but also for their ability to access critical services and information.
With frequent environmental disruptions to livelihoods, it is not hard to imagine that increasingly frequent and severe disasters could fundamentally alter retirement trajectories and financial security in old age (Jay et al., 2023). Consequently, the stabilizing role of social safety net programs for older adults during displacement events cannot be overstated. This is especially true for Social Security, in addition to FEMA assistance, which provides consistent income support that follows beneficiaries regardless of location and serves as a critical lifeline when other support systems may be compromised. Strengthening social insurance mechanisms, ensuring seamless benefit access, and providing protection from fraud must be prioritized to protect older Americans’ well-being as disaster risks are on the rise.
Another type of service deficit lies in disaster response: A recent study of wildfire risk to communities (Winkler & Mockrin, 2025) found increasingly older populations in areas of wildfire risk—largely due to aging in place—and noted implications for services that combat such fires. With population aging, fire departments that rely upon volunteers, who are mostly young and can respond quickly, will need to be staffed differently. While such services have been on the decline in rural areas at risk of fire (Colibaba et al., 2021), as more adults age in place, it will be crucial to understand the implications of these demographic shifts for a full range of disaster-specific responses (e.g., fires, floods, storms, tornadoes, and those associated with increasing temperatures, which was not included in the list of disasters in our study).
The present analysis underscores the critical need for near-real-time monitoring of displacement across the life course, but particularly among older adults because they tend to have additional vulnerabilities, to inform responsive policy interventions that address immediate needs and long-term resilience. By describing displaced populations through nationally representative data, researchers and policymakers can develop targeted support systems that may prevent the cascade of negative health outcomes associated with forced relocation in later life. As researchers working at the intersection of demography, aging, and disasters, we are concerned about recent federal decisions to stop tracking the costs of extreme weather events (e.g., Dzombak & Tabuchi, 2025) and urge that important nationwide microdata collection efforts on natural disaster impacts continue, such as through the longitudinal HTOPS.
Acknowledgements: We are grateful to the CUNY Climate Scholars Program for their support of JK Goongoon.
Jenna F. Tipaldo is a doctoral candidate in Environmental & Planetary Health Sciences at CUNY Graduate School of Public Health and Health Policy, is an adjunct lecturer at Hunter College, and has an Advanced Certificate in Demography from the CUNY Graduate Center; JK A. Goongoon is a recent graduate with a Bachelor’s of Engineering / Bachelor’s of Art from CUNY City College, who contributed to this project through the CUNY Climate Scholars Program. She is now a Water Engineer at Arcadis; Frank W. Heiland, PhD, is the associate director of the CUNY Institute for Demographic Research in New York City and a professor of Public and International Affairs at CUNY-Baruch College. He also has an appointment at the CUNY Graduate Center; Deborah Balk, PhD, is the Director of the CUNY Institute for Demographic Research and a professor of Public and International Affairs at CUNY Baruch College. She also has appointments at the CUNY Graduate Center and at the CUNY School of Public Health and Health Policy. All authors are in New York City.
Photo credit: Shutterstock/PeopleImages
References
Aguirre‐Torres, L., Leichenko, R., Austerman, M., Balk, D., Bond, H. E., Breen, R. E., Burgy, D., John, C., Parker, F., Schlather, K., & Stevens, A. (2024). New York State climate impacts assessment chapter 08: Society and economy. Annals of the New York Academy of Sciences, 1542(1), 446–500. https://doi.org/10.1111/nyas.15199
Arigoni, D. (2023). Climate resilience for an aging nation. Island Press.
Aung, T. W., & Sehgal, A. R. (2024). Prevalence, correlates, and impacts of displacement because of natural disasters in the United States from 2022 to 2023. American Journal of Public Health, 115(1), 55–65. https://doi.org/10.2105/AJPH.2024.307854
Brooks, T., Lee, S. L., Berry, H., & Toney, M. B. (2010). The effects of occupational aspirations and other factors on the out-migration of rural youth. Journal of Rural and Community Development, 5(3), 19–36.
Bukvic, A., Gohlke, J., Borate, A., & Suggs, J. (2018). Aging in flood-prone coastal areas: Discerning the health and well-being risk for older residents. International Journal of Environmental Research and Public Health, 15(12), 2900. https://doi.org/10.3390/ijerph15122900
Choi, C.-Y., Zhang, Y., Hummel, M., & Qian, Q. (2025). Reassessing the economic impacts of Hurricane Harvey on Texas: A closer look with granular analyses. Natural Hazards 121(5), 5921–5945. https://doi.org/10.1007/s11069-024-07000-6
Colibaba, A., Russell, E., & Skinner, M. W. (2021). Rural volunteer fire services and the sustainability of older voluntarism in ageing rural communities. Journal of Rural Studies, 88, 289–297.
Connor, D. (2025, April 10). The changing demography of disaster impact in the United States, 2012–2022 [Conference presentation]. Population Association of America Annual Meeting, April 10–13, 2025., Washington, DC.
Curtis, K. J., Fussell, E., & DeWaard, J. (2015). Recovery migration after Hurricanes Katrina and Rita: Spatial concentration and intensification in the migration system. Demography, 52(4), 1269–1293. https://doi.org/10.1007/s13524-015-0400-7
Dzombak, R., & Tabuchi, H. (2025). U.S. government to stop tracking the costs of extreme weather. The New York Times. https://www.nytimes.com/2025/05/08/climate/noaa-billion-dollar-disasters.html
Fussell, E., & Castro, B. (2022). Environmentally informed migration in North America. In L. M. Hunter, C. Gray, & J. Véron (Eds.), International handbook of population and environment (Vol. 10, pp. 205–223). Springer International Publishing. https://doi.org/10.1007/978-3-030-76433-3_10
Goodman, L., Zhu, L., Visalli, K., & Zinn, A. (2024). Expanding access to home equity could improve the financial security of older homeowners. Urban Institute. https://www.urban.org/urban-wire/expanding-access-home-equity-could-improve-financial-security-older-homeowners
Jay, A. K., Crimmins, A. R., Avery, C. W., Dahl, T. A., Dodder, R. S., Hamlington, B. D., Lustig, A., Marvel, K., Méndez-Lazaro, P. A., Osler, M. S., Terando, A., Weeks, E. S., Zycherman, A., Crimmins, A. R., Avery, C. W., Easterling, D. R., Kunkel, K. E., Stewart, B. C., & Maycock, T. K. (2023). Chapter 1: Overview. Fifth national climate assessment. U.S. Global Change Research Program. https://doi.org/10.7930/NCA5.2023.CH1 (recently removed); https://repository.library.noaa.gov/view/noaa/61592
Madajewicz, M. (2020). Who is vulnerable and who is resilient to coastal flooding? Lessons from Hurricane Sandy in New York City. Climatic Change, 163(4), 2029–2053. https://doi.org/10.1007/s10584-020-02896-y
Merdjanoff, A. A., Piltch-Loeb, R., Friedman, S., & Abramson, D. M. (2019). Housing transitions and recovery of older adults following Hurricane Sandy. The Journals of Gerontology: Series B, 74(6), 1041–1052. https://doi.org/10.1093/geronb/gby126
Phillips, S. (2025). The Palisades and Eaton Fires: Neighborhood data and potential housing market effects. Lewis Center for Regional Policy Studies at UCLA. https://www.lewis.ucla.edu/research/the-palisades-and-eaton-fires-neighborhood-data-and-potential-housing-market-effects/
Smith, A. B. (2025). U.S. billion-dollar weather and climate disasters, 1980–present (NCEI accession 0209268) [Dataset]. National Oceanic and Atmosphere Administration, National Centers for Environmental Information. https://doi.org/10.25921/STKW-7W73
Tagtachian, D., & Balk, D. (2023). Uneven vulnerability: Characterizing population composition and change in the low elevation coastal zone in the United States with a climate justice lens, 1990–2020. Frontiers in Environmental Science, 11, 1111856. https://doi.org/10.3389/fenvs.2023.1111856
Tipaldo, J. F., Balk, D., & Hunter, L. M. (2024). A framework for ageing and health vulnerabilities in a changing climate. Nature Climate Change, 14, 1125–1135. https://doi.org/10.1038/s41558-024-02156-2
U.S. Census Bureau. (2023). S1901: Income in the past 12 Months (in 2023 inflation-adjusted dollars) [Table, American Community Survey]. United States Department of Labor. https://data.census.gov/table/ACSST1Y2023.S1901?q=household%20income
U.S. Census Bureau. (2024a, September 16). Evolving the Household Pulse Survey. United States Department of Labor. https://www.census.gov/newsroom/blogs/random-samplings/2024/09/evolving-household-pulse-survey.html
U.S. Census Bureau. (2024b). Source of the data and accuracy of the estimates for the Household Pulse Survey—Phase 4.0—Cycle 03. United States Department of Labor. https://www2.census.gov/programs-surveys/demo/technical-documentation/hhp/Phase4-0_Source_and_Accuracy_Cycle03.pdf
U.S. Census Bureau. (2025). Household Pulse Survey public use file (PUF). United States Department of Labor. https://www.census.gov/programs-surveys/household-pulse-survey/data/datasets.html
Waters, L., Best, K., Miao, Q., Davlasheridze, M., & Reilly, A. C. (2024). Under-reported and under-served: Disparities in US disaster federal aid-to-damage ratios after hurricanes. International Journal of Disaster Risk Reduction, 106, 104430. https://doi.org/10.1016/j.ijdrr.2024.104430
Winkler, R. L., & Mockrin, M. H. (2025). Aging and wildfire risk to communities (Report no. EIB-284). U.S. Department of Agriculture, Economic Research Service. https://doi.org/10.32747/2025.9015828.ers
Zuelsdorff, M., & Limaye, V. S. (2024). A framework for assessing the effects of climate change on dementia risk and burden. The Gerontologist, 64(3), gnad082. https://doi.org/10.1093/geront/gnad082