In the United States it is well-documented that there are huge gaps in healthcare access, treatment and outcomes for minority populations (IOM, 2003; Riley, 2012). American Indians and Alaska Natives (AIAN)* experience these disparities and inequities at higher rates on many indicators as compared to all other groups.
Feeding into health disparities are the dearth of studies, inadequate studies and limited or incorrect data on AIAN health. Further, an almost complete lack of historical, geographical, cultural, political and legal education vis-à-vis health implications for AIAN persists among the health professions and in their education.
The problem grows when specifically looking at older AIAN. However, it is important to note that AIAN do not represent a cultural/race monolith. An example of variations in both the populations’ realities and in data can be seen in reported life expectancies. When looking at national numbers, AIAN life expectancy at birth appears to be only approximately five years less than U.S. all races (73.7 years versus all races life expectancy of 78.1). However, when drilling down to tribe-specific or even region-specific data, huge disparities appear.
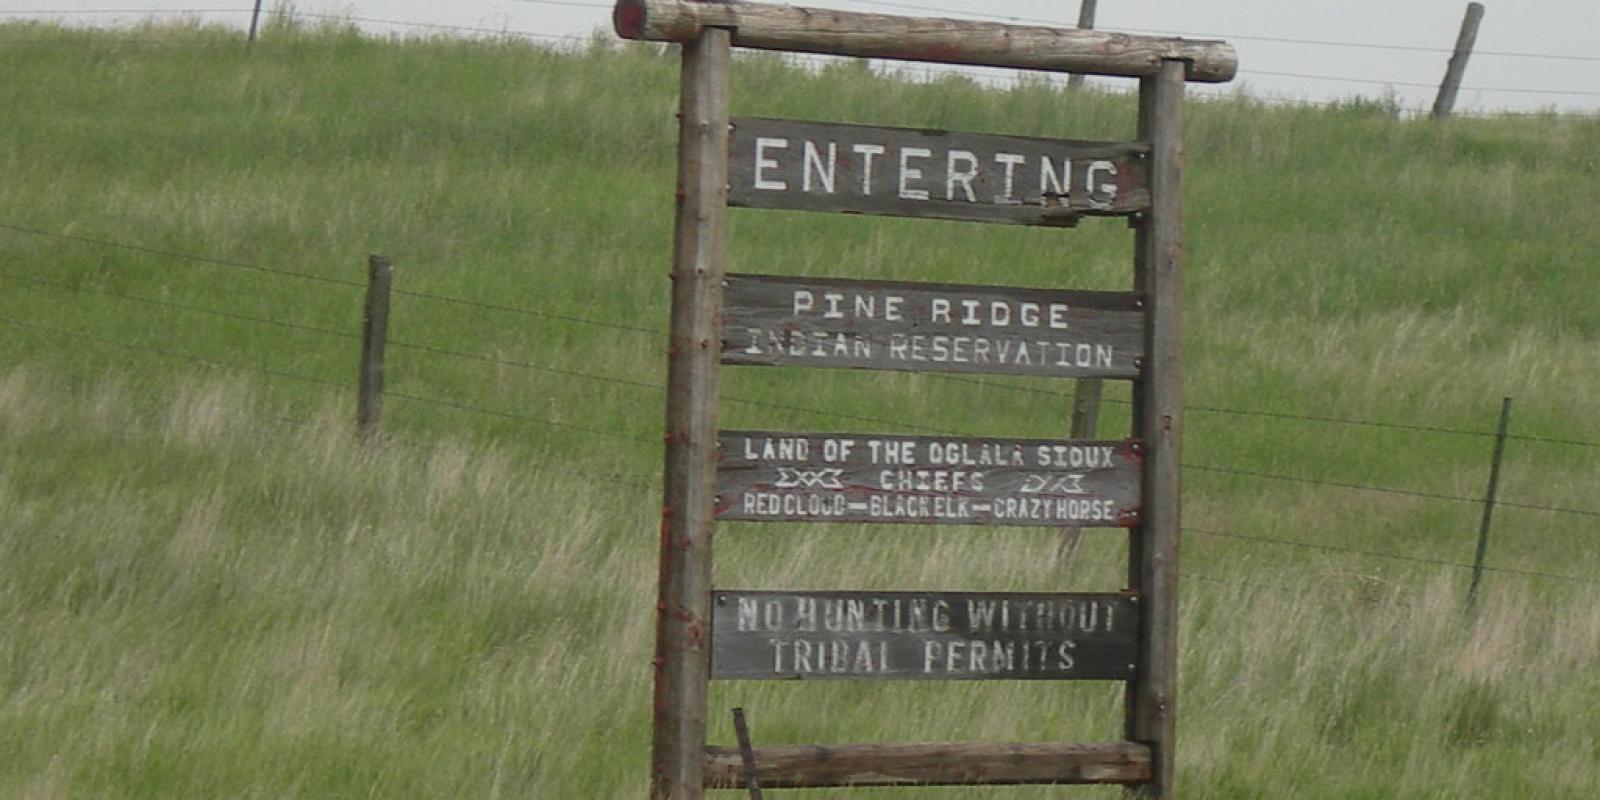
The average life expectancy on the Pine Ridge Reservation in South Dakota, in the Great Plains Administrative Area of Indian Health Service, is widely reported as 47 years for men and 52 years for women. This is not only the lowest in Indian Country, or in the United States, but in the Western Hemisphere. This is a stunning disparity when compared to life expectancy for White women in the United States at 81 years, and reflects life expectancies of the White population from more than 120 years ago. Even in the above cited Centers for Disease Control and Prevention (CDC) report there is no AIAN data on life expectancy, although the word race appears in the title.
Older American Indians/Alaska Natives and Health Disparities
AIAN older than age 65 reporting one race make up 4.3 percent of the AIAN population. Those AIAN older than age 65 who report more than one race are approximately 9 percent of the AIAN population (ACL, 2017), or about 500,000.
Compare this to U.S. all races older than age 65 at 15.2 percent of the population and 49.2 million in number. Disparity in health indicators results in health inequities, or “Differences in health that are avoidable, unfair, and unjust. Health inequities are affected by social, economic, and environmental conditions.” And in the case of AIAN, historic harms and nearly insurmountable losses purposively targeted through law and policy over hundreds of years separate them from all other minority groups.
Scarcity of Research/Reporting
A quick search in PubMed under “American Indian” aging with no filters reveals 110 hits. Remove “American Indian” and there are more than half a million. This points to few national studies, and scattered regional or tribal studies.
One national study used GIS (Geographic Information System) and the U.S. Census to map functional disability in older AIAN, ostensibly a key indicator for the need for long term care. Results showed regional variations as to which Activities of Daily Living (ADLs) or Instrumental ADLS (IADLs) were more limiting. Overall, AIAN older than age 65 had functional disability at 57.6 percent versus all races at 41.9 percent.
The average life expectancy on the Pine Ridge Reservation in South Dakota is the lowest in the Western Hemisphere.
Mortality rates for Alzheimer’s disease (AD) in AIAN per 100,000 is 102.3 (see Table 1, below) and is less than that reported for Whites (223 per 100,000) according to the Indian Health Service. And yet, there are very few studies on AD in the AIAN population. As Alzheimer’s Disease is a disease of aging, possible explanations for the reported lower numbers of AD deaths in AIAN are: few AIAN are represented in the older than age 65 group; there is a vast misidentification/ misreporting of AIAN as the appropriate race upon death; and a misunderstanding on how AIAN may view and seek help for AD.
Table 1. -The 10 Leading Causes of Death for AIAN Older Than Age 65 as Compared to Whites
| All Causes | AIAN Adjusted (N) 17,218 |
AIAN Rate per 100,000, Adjusted | U.S. White Rate |
| Diseases of the Heart | 4,018 | 980.8 | 1,301.4 |
| Malignant Neoplasms | 3,721 | 908.8 | 1,021.4 |
| Diabetes mellitus | 1,335 | 325.9 | 122.5 |
| Chronic lower respiratory disease | 1,105 | 269.7 | 334.9 |
| Cerebrovascular diseases | 936 | 228.5 | 295.7 |
| Pneumonia and Influenza | 513 | 125.2 | 127.1 |
| Unintentional injury | 507 | 123.8 | 107.0 |
| Nephritis, nephrotic syndrome and nephrosis | 506 | 123.5 | 98.0 |
| Alzheimer’s Disease | 419 | 102.3 | 223.3 |
| Septicemia | 342 | 83.5 | 66.3 |
Source: Indian Health Service, Trends in Indian Health, page 56.
National data from governmental reports also is limited. The Indian Health Service (IHS) reports on its 2.56 million patient count of the 6 million enumerated AIAN in the Census. Mortality figures for AIAN older than age 65, all causes, reveal 999.1 deaths per 100,000 versus 747.0 in all races. The 10 leading causes of death for AIAN older than age 65 as compared to Whites show disparities in diabetes, kidney diseases, unintentional injury and septicemia (See Table 1, below).
The CDC reported results from a 14-state study where the cumulative incidence of laboratory-confirmed COVID-19 cases among AIAN was 3.5 times that among White persons. COVID-19 mortality rates among AIAN were 10.5 (20-29 years), 11.6 (30-39 years) and 8.2 (40-49 years) times those for White persons in those age groups. Although numbers were not as high for the old-old groups, there were huge losses in knowledge keepers, language speakers and elders as a whole. This devastation on top of the younger generational losses reflect ongoing historical losses for this population.
Underlying Causes of Disparities
Some historians say, at the population zenith, there were anywhere from 20 to 80 million Indigenous people prior to European contact in what is now Canada and the United States. The nadir is around 200,000 in the United States at the 1900 census. The hard reality is that genocide took place to near “extinction” of the Indigenous population. Yet, this fact is rarely taught. Those AIAN from ages 65 through 90 and older have lived through the “Kill the Indian Save the Man/Child” Assimilation Era, those in their late 90s may not have been born as U.S. citizens, and others carry the marks of intergenerational trauma.
Federal Indian Policy periods spanning around 160 years were meant to, “Get Rid of the Indian Problem,” however, few Americans seem to know about this directive. The most harmful eras were Removal and Reservations (1829-1886), Assimilation (1887-1932) and Termination and Relocation (1946-1960). These eras and the ongoing manifestations can directly be mapped onto the United Nations’ definition of genocide. These policy periods either directly or indirectly affected today’s AIAN older adults and their parents.
Some genocidal situations causing intergenerational trauma were forced attendance at boarding schools, sterilization at Indian hospitals in the 1970s, institutionalization at the Asylum for Insane Indians in Canton, S.D., sweeping removal of children through the boarding schools, and adoptions and foster placement into mostly White homes. Plus, relocation programs to large cities that left AIAN further disconnected. Loss of religion, language, food and traditions splintered families.
Federal government actions resulted in high poverty, lower Western education, food insecurity, high arrest and prison rates and scarcity on all scales.
All these actions on the part of the federal government resulted in high poverty, lower Western education, food insecurity, high arrest and prison rates and scarcity on all scales. The numbers worsen as adults reach older age.
Indigenization of Practice and Health Professions Education
Trauma, both historical and contemporaneous, should always be assessed and ruled out or treated. Researchers and practitioners should be aware of the tribes in their state, region and catchment areas.
How many federally recognized tribes are there? 574. What is a federally recognized tribe? A tribe is recognized by Congress with a government-to-government relationship with the United States, and is eligible for funding and services from the Bureau of Indian Affairs, and IHS.
What is a state-recognized tribe? And why is it important to know the status of your patient? In terms of services available to enrolled members of federally recognized tribes, many are for no charge, to include dentures, glasses, medications and office visits at an Indian Health Service facility; not true for state recognized or no tribal affiliation persons.
An important point for practitioners to note is that AIAN health data is often missing, and at times unreliable. Indigenous people in the United States are misidentified as another race more than any other group. There is a notation as such in the IHS Trends report more than 130 times.
Misidentification “throws off” numbers, including death records, cancer registries, hospital admissions and COVID-19 case counts, making underreported data the norm for this population, and therefore precludes culturally responsive, equitable care. Undercounts relieve the “system” of the needed targeted, persistent, fully funded, systemic care for this population.
Therefore, asking (all) patients to identify themselves, if and as they would like, and then further evaluate social determinants of health will take the patient and data a long way toward “moving the disparity needle.” In order to understand health status, care access, treatment needs, etc., a practitioner should know who is in their care.
*There are many terms for Indigenous people from North America. Here, AIAN is used to connote those people from the 48 contiguous states and Alaska. At times Indigenous will be used.
Margaret Moss, PhD, JD, RN, FAAN (Hidatsa, Dakhóta), is director, First Nations House of Learning Faculty of Applied Science, and associate professor in the School of Nursing at the University of British Columbia in Vancouver, BC.


