Abstract
The United States initially developed a long-term care system that prioritized nursing home care over in-home care, particularly for those supported by the Medicaid program. Legislation in 1981 attempted to change that strategy, but progress was slow. Today, however, the long-term services system has been altered in most states to emphasize home- and community-based services as a major option supported by the Medicaid program. Using Ohio as a case study, the system change is highlighted in this article, and policy issues for tomorrow are discussed.
Key Words
home- and community-based services, long-term services system reform, future long-term services challenges
In 1995, former IBM CEO Louis Gerstner, Jr., titled his book about the IBM business comeback, Who Says Elephants Can’t Dance?
In a similar vein, an aging policy question raised in discussion about long-term care was, “Could federal and state governments that were spending almost all of their Medicaid long-term care funds on nursing homes, change course?” Analysts had similar expectations about the possibility of altering the balance between institutional care and home- and community-based services as skeptics did about IBM’s ability to develop a personal computer.
Despite this pessimism, the long-term services system in the United States has changed dramatically over the past 4 decades. These changes occurred in public and private sectors and included the expansion of in-home care providers in public and private markets, the development of an entirely new assisted living industry, and a dramatic shift in how Medicaid spends long-term service dollars. After presenting national trends, this article will use a 3-decade study done in the state of Ohio as a case example to document how the United States has changed its approach to providing long-term services to older Americans.
The National Context
Beginning in the 1970s, a series of home-care demonstrations designed to test the effectiveness of expanding in-home services as an alternative to nursing home care were implemented across the nation (Kemper et al., 1987). This line of research culminated in the ten-state, large-scale National Long-Term Care Channeling Demonstration and Evaluation (1981–1985; Kemper et al., 1988).
With momentum from interest in these research efforts and the work of the long-term services and supports (LTSS) advocacy community, in 1981 the U.S. Congress passed legislation creating the option for states to apply to the federal government for waivers, which would allow them to use Medicaid funds for non-Medicaid long-term services (Miller, 1992). These expanded home- and community-based services (HCBS) were designed to allow Medicaid beneficiaries to receive the services they needed to help them live independently for as long as possible. Services include personal care/homemaker, home-delivered meals, transportation, respite care, adult day services, and emergency response systems. To be eligible for Medicaid HCBS, an individual had to have very limited financial resources and high levels of disability, defined as meeting the nursing home level of care criteria for their state (AARP, 2021).
This review of national data highlights how Medicaid has shifted its LTSS funding strategy.’
The change in Medicaid LTSS expenditure patterns between 1990 and 2020 has been remarkable (See Table 1, below). Over the past 4 decades, nationally Medicaid has shifted from having almost all long-term care funding allocated to institutionalized care—primarily nursing facilities—to more funds supporting home- and community-based opportunities.
In 1990, Medicaid spent $44.6 billion, or 87% of all Medicaid LTSS expenditures, on institutional care compared to $6.4 billion on HCBS (Medicaid.gov, n.d.-b). By 2020, Medicaid HCBS expenditures had risen to $124.6 billion, representing 62% of total Medicaid LTSS spending (Eiken, Sredi, Burwell, & Amos, 2016; Eiken, Sredi, Burwell, & Saucier, 2018; Stepanczuk, Eckstein, et al., 2024).
Medicaid expenditures on institutional care increased between 1990 and 2000 from $44.6 billion to $74.8 billion, but since 2000 have remained flat. In comparison, from 1990 and 2020, Medicaid expenditures on HCBS have increased more than $100 billion (Medicaid.gov, n.d.-a; Wysocki et al., 2023).
Table 1. National Estimates of Medicaid LTSS Expenditures in Billions of Dollars: 1990–2020
| Service Category | 1990 | 2000 | 2010 | 2020 |
| HCBS LTSS | $6.5 | $27.6 | $71.5 | $124.6 |
| Institutional LTSS | $44.6 | $73.3 | $78.0 | $74.8 |
| Total LTSS | $51.0 | $100.9 | $149.4 | $199.4 |
| Total Medicaid | $113.2 | $258.0 | $420.6 | $597.6 |
Sources: Wysocki et al. (2023) and Medicaid.gov, (n.d-b). Note: Expenditures from 1990 to 2010 have been adjusted for inflation. HCBS = home- and community-based services; LTSS = long-term services and supports.
A more detailed overview of the funding allocations associated with institutional and HCBS in 2020 is shown in Table 2, below. Medicaid HCBS includes waivers that provide support for individuals with intellectual and developmental disabilities (IDDs), older adults, people with physical disabilities, individuals with serious mental health conditions, people who are medically fragile or technologically dependent, people with HIV/AIDS, and those with brain injuries.
Many states now provide 1915(c) waivers through home- and community-based settings to support a number of these eligible populations. These 1915(c) waivers, at $50 billion, accounted for about 40% of total Medicaid HCBS spending in 2020 (Wysocki et al., 2023). The personal care option was the second largest Medicaid HCBS expenditure category, with the $24 billion spent accounting for just less than 20% of total Medicaid HCBS expenditures (Wysocki et al., 2023). An array of other waivers and now well-established programs such as the Program of All- Inclusive Care for the Elderly (PACE) round out the list.
Table 2. National Estimates of Institutional and HCBS Medicaid LTSS Expenditures: 2020
| Service Category | Expenditure Estimate (In billions of $) |
| Total HCBS: $124.6 billion (62.5%) | |
| Section 1915(c) waiver program | $50.4 |
| Personal care | $24.0 |
| 1915(k) / Community First | $14.3 |
| Other HCBS/MLTSS | $10.2 |
| Home health | $5.7 |
| Rehabilitation Services (non-school-based) | $3.1 |
| Case Management | $3.1 |
| PACE | $2.7 |
| Private Duty Nursing | $1.1 |
| Health Homes | $0.8 |
| 1915(i) / State Plan HCBS | $1.0 |
| 1915(j) / Self-directed Personal Assistance | $0.4 |
| MFP | $0.2 |
| Total Institutional LTSS: $74.8 billion (37.5%) | |
| Nursing Facility | $54.6 |
| ICF/IID: Total | $8.1 |
| Mental Health Facilities | $6.8 |
| Other Institutional LTSS/MLTSS | $0.3 |
| Other | $5.0 |
| Total LTSS: $199.4 billion (33.4%) | |
| Total Medicaid: $599.6 billion | |
Source: Wysocki et al. (2023). Note: HCBS = home- and community-based services; MLTSS = managed long-term services and supports; PACE = programs of all-inclusive care for the elderly; MFP = money follows the person; LTSS = long-term services and supports; ICF/IID = intermediate care facilities for individuals with intellectual disabilities.
Expenditures for HCBS 1915(c) waivers vary by the groups being served. For example, in 2020, waivers supporting individuals with intellectual disabilities were $28.6 billion and waivers serving older people and individuals with physical disabilities were $8.8 billion (See Table 3 below Table 2; Wysocki et al., 2023). These differences were the result of higher care plan expenditures for those using the individuals with intellectual disabilities waiver ($48,900 compared to $17,600).
This review of national data highlights how Medicaid has shifted its LTSS funding strategy. But how have these changes affected states responsible for administering the LTSS system? In the remainder of this article, we provide data from a 32-year longitudinal study tracking long-term services use for older adults in Ohio. This data provides a case study in how changes in federal and state policy have impacted the LTSS system at the state level.
Table 3. National 1915(c) Waiver Expenditures Per Group: 2010–2020
| 1915(c) Waiver Group | Total Estimated Expenditures, 2010 (In billions of $) | Total Estimated Expenditures, 2020 (In billions of $) | Average Expenditure Per Person, 2020 |
| Older Adults & People with Physical Disabilities | $9.5 | $8.8 | $17,600 |
| Individuals with Intellectual Disabilities | $28.6 | $38.6 | $48,900 |
Sources: Wysocki et al. (2023), Lee (2022), and Medicaid.gov (n.d.-b). Note: Expenditures from 2010 have been adjusted for inflation.
Ohio as a Case Example
Ohio began studying LTSS in the state in 1993 to evaluate its new and controversial nursing home pre-admission screening process, but has continued to track LTSS use and service quality longitudinally over the past 3 decades. Ohio’s longitudinal study of LTSS tracks HCBS participation in the community and includes a survey of assisted living communities and nursing facilities.
Similar to the nation overall, Ohio is aging. In 1990, the state had 1.4 million people ages 65 and older and 137,600 ages 85 and older (Census, 1992). By 2020, those numbers had grown to 2.1 million ages 65 and older and 269,100 ages 85 and older (Scripps Gerontology Center & Ohio Department of Development, 2024).
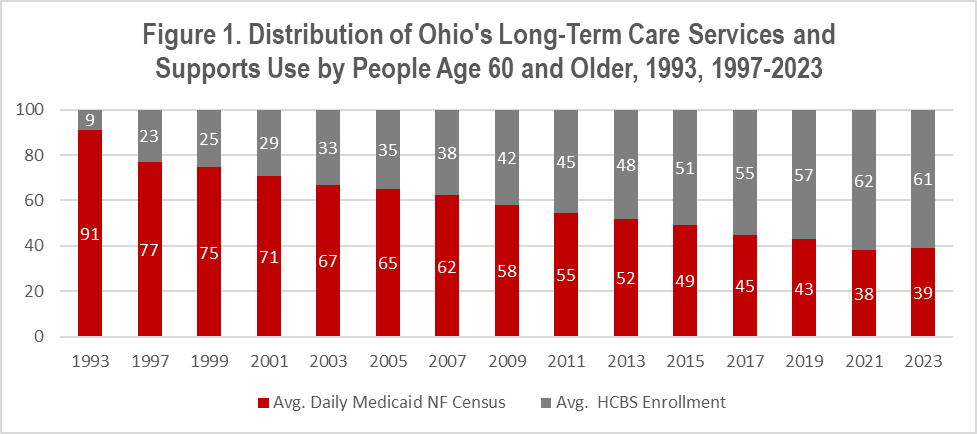
The major demographic changes experienced in Ohio have been accompanied by considerable shifts in how LTSS are delivered. As shown in Figure 1, below, in 1993, the first year of this longitudinal study, nine in ten Ohioans ages 60 and older with severe disability who were supported by Medicaid received services in the nursing home setting (Applebaum et al., 2025).
‘In 2023, 92,460 Ohioans ages 60 and older received LTSS through the federal/state Medicaid program.’
Over the past 30 years Ohio has shifted its approach and by 2023, six in ten (61%) of those ages 60 and older with high levels of disability and supported by Medicaid received HCBS, rather than nursing home care (Applebaum et al., 2025). Once ranked as the 47th worst in the nation in terms of HCBS use, by 2020, Ohio had increased its HCBS use, ranking 14th in the nation (AARP, 2021). This reflects the state’s commitment to HCBS expansion.
Sources: Applebaum et al., 2025.
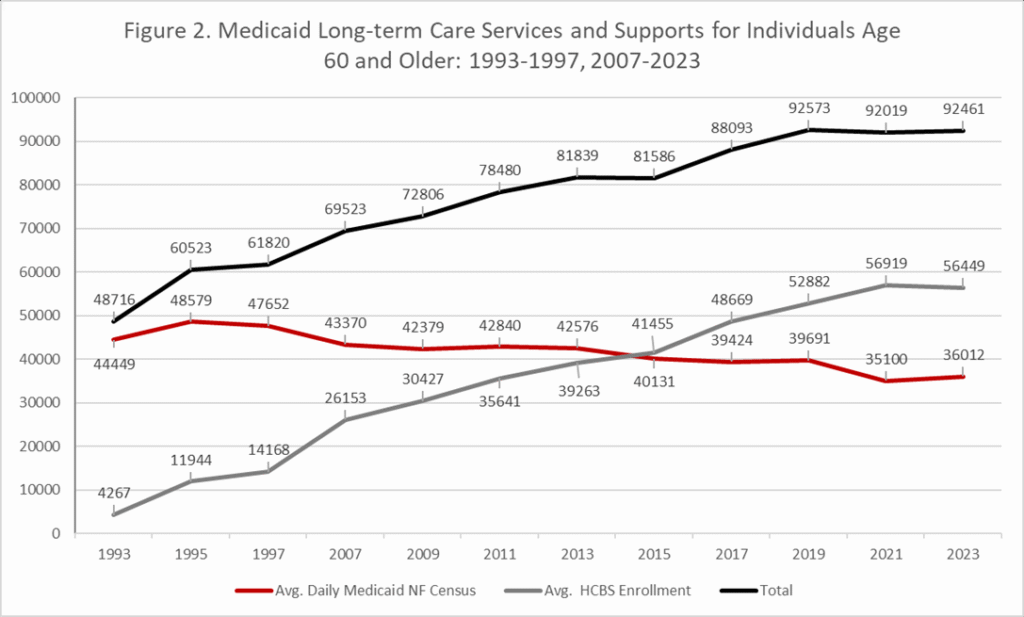
As shown in Figure 2, below, in 2023, 92,460 Ohioans ages 60 and older received LTSS through the federal/state Medicaid program (Applebaum et al., 2025). Slightly more than 36,000 older Ohioans were nursing home residents using Medicaid-supported care (Applebaum et al., 2025). Ohio’s HCBS waiver programs served just less than 56,450 individuals ages 60 and older, accounting for 61% of older people receiving Medicaid LTSS (Applebaum et al., 2025).
Older Ohioans receive HCBS through three Medicaid programs. For older Ohioans living in the state’s urban counties, who are dually eligible for Medicaid and Medicare, HCBS are provided as part of an integrative care demonstration known as MyCare. In the MyCare program, health plans across the state’s urban counties receive a capitated reimbursement from Medicaid and Medicare and are required to fund a comprehensive package of acute and long-term services.
Older people in non-MyCare counties and those ages 60 and older who are not yet eligible for Medicare, regardless of county, remain in the fee-for-service Medicaid program and receive LTSS through Ohio’s PASSPORT and Assisted Living Medicaid Waiver Program. On a typical day the PASSPORT program serves about 24,000 older individuals and the assisted living waiver serves about 4,000. MyCare typically provides HCBS to around 29,000 older Ohioans (Applebaum et al., 2025).
Source: Applebaum et al. (2025).
A Changing Nursing Home
To gain a better understanding of how the LTSS system has changed, we present data on Ohio’s nursing home industry over time. As shown in Table 4, below, Ohio had fewer licensed nursing home beds in 2023 than it did in 2001 (–10.5%), despite an increase by more than 50,000 in the number of people ages 85 and older over this same period (Applebaum et al., 2025).
The change in the number and source of admissions is also noteworthy. In 1992, Ohio had just less than 71,000 nursing home admissions, of which 30,000 (or 43%) were individuals coming from the hospital and covered by the Medicare program (Applebaum et al., 2020). By 2023, the number of admissions was 182,000, of which about 127,000 (or 70%) were Medicare admissions (Nelson et al., 2025).
As a nation we spend substantial resources through the Medicare and Medicaid programs to assist individuals with medical care and long-term services.’
Across three decades, the nursing home industry changed to include many short-stay individuals in addition to the long-stay residents who had represented a large portion of residents in earlier time periods. Data on nursing home occupancy rates during these 30 years also tell a story of change. In 1992, Ohio nursing homes had an occupancy rate of 91.9% (Applebaum et al., 2020), but by 2023, the occupancy rate was 77.9% (Applebaum et al., 2025).
While the 2023 rate reflects a recovery from the pandemic, it is important to recognize that occupancy rates had been steadily dropping over the 30-year study period. The drop is more pronounced when factoring in the fact that the number of licensed beds in the state declined by 7,200 across those 30 years.
Table 4. Nursing Home Use in Ohio, 1992–2023
| Year | 1992 | 2001 | 2011 | 2019 | 2021 | 2023 |
| Total beds in service | 91,531 | 94,231 | 94,710 | 88,793 | 86,129 | 84,325 |
| Total Admissions | 70,879 | 149,905 | 207,148 | 213,833 | 172,300 | 182,007 |
| Medicare resident admissions | 30,359 | 90,693 | 148,426 | 151,267 | 123,862 | 126,594 |
| Total Occupancy Rates | 91.9 | 83.2 | 83.2 | 80.0 | 71.8 | 77.9 |
Sources: Nelson et al., 2025.
Is the Expansion of Home Care an “Add-On” to the System?
While the expansion of HCBS was widely supported by policymakers in Ohio, there were cost concerns about initial policy changes. On one hand, access to HCBS gave the opportunity for Ohioans who were going to use a nursing home to receive HCBS, which lowered the cost. But, the potential for new additional public expenditures existed if Ohioans who previously had not received Medicaid-supported LTSS sought out Medicaid-supported HCBS. The debate about potential “add-on” costs received considerable attention, but limited empirical evidence existed to address the question.
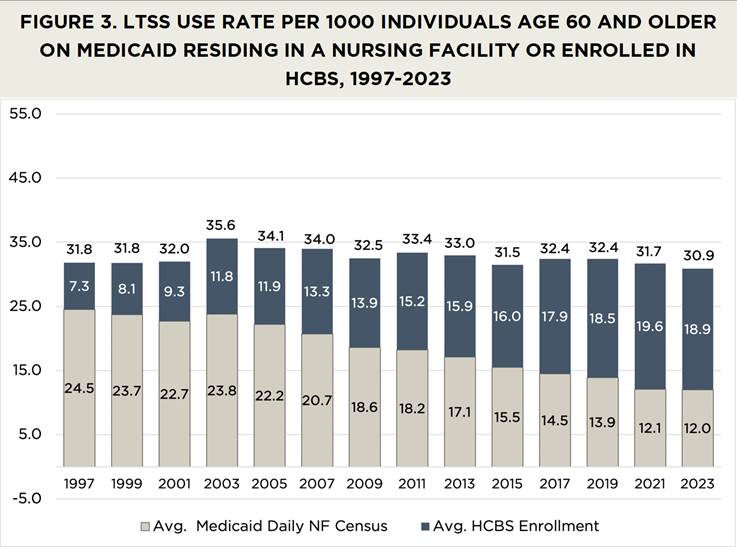
Figure 3, below, provides longitudinal data examining nursing home and HCBS use as a proportion of the total ages 60 and older population. In 1997, the proportion of Ohioans ages 60 and older using Medicaid long-term services was 31.8 per 1000. In that year most use occurred in the nursing home setting, 24.5 per 1,000, compared to 7.3 per 1,000 for HCBS (Applebaum et al., 2025). As Ohio expanded the use of HCBS, the overall utilization rate remained steady and by 2023, that rate was lower than it had been in 1997, at 30.9 per 1,000 (Applebaum et al., 2025). Consistent with expanding HCBS, the nursing home use rate was cut in half, dropping from 24.5 to 12.4 per 1,000, while the HCBS use rate more than doubled, from 7.3 to 18.7 per 1,000 (Applebaum et al., 2025). The constant use rate from 1997 to 2023 indicates that the HCBS expansion was offset by a reduction in nursing home use, rather than representing a service add-on, which had been the concern of 3 decades prior.
Source: Applebaum et al., 2025.
Lessons From Three Decades of Change
The shift in the way long-term services are provided in the nation and in Ohio is dramatic. For Ohio, a state with a powerful nursing home lobby, change of this magnitude was unimaginable three decades ago. In the early 1990s, lobbyists for Ohio’s nursing home industry had successfully fought against legislation attempting to expand HCBS on the grounds that individuals with high levels of disability would not be safe at home. Funding for the first year of Ohio’s longitudinal LTSS study in 1993 came from pressure by the nursing home industry arguing that nursing home pre-admission screening would mean care delays that would harm those living in the community. Three decades later, with more people with high needs levels being served in the community rather than living in nursing homes, the safety and quality-of-life benefits of the HCBS option have been well documented.
Despite clear evidence on the success of HCBS, its expansion and continued growth is not without challenges. To ensure HCBS remains the critical element of the LTSS system, two major changes will be necessary: 1) providing support further “upstream” to older people beginning to experience activity and instrumental activities of daily living limitations; and 2) reducing the over-reliance on Medicaid to fund LTSS.
As a nation we spend substantial resources through the Medicare and Medicaid programs to assist individuals with medical care and long-term services. While we recognize the importance of helping older people in need, providing supports prior to a crisis could pay dividends. The Older Americans Act resources used to support these types of programs are limited and have not kept up with inflation or older population growth (Congressional Research Service, 2023).
In most states, Medicaid is the major financing mechanism for LTSS. However, nine in ten older people are not eligible for Medicaid, only becoming eligible when their LTSS needs become so substantial that their financial resources are depleted (Lee & Jarosz, 2017). In our Ohio data, we find about 40% of older individuals with high levels of disability end up on Medicaid HCBS and two-thirds of those needing nursing home care are supported by Medicaid (Applebaum et al., 2025).
Several recent studies have shown that states with fewer supportive services in the community, such as home-delivered meals and personal care, had a higher proportion of low-care residents in nursing homes (Thomas & Mor, 2013).Another study found that individuals receiving congregate meals were less likely to be admitted to nursing homes or to be admitted to hospitals, compared to a comparable group of older people not receiving meals (Mabli et al., 2020).
Finally, some recent work has highlighted the success of combining supportive services in the community with healthcare services. Area agencies on aging that had partnerships to link community services with healthcare organizations showed significantly lower hospital readmission rates and significantly fewer low-care residents in nursing homes (Brewster et al., 2020). Not providing resources to support individuals prior to the crisis means they will enroll in Medicaid earlier and families will endure more hardship.
The changes that have occurred to the LTSS system were almost unimaginable three decades ago. However, the demographic and service hurdles of tomorrow will continue. What our experience has taught us is that we can respond to these new and never experienced challenges associated with population aging, but it will take creativity, commitment, and cooperation to succeed.
Robert Applebaum, PhD, is a senior research scholar; Matt Nelson is a research scholar; Bailee Brekke is a doctoral student in gerontology and a research assistant; and John R. Bowblis is a professor of Economics, Farmer School of Business and a research fellow; all at the Scripps Gerontology Center, Miami University.
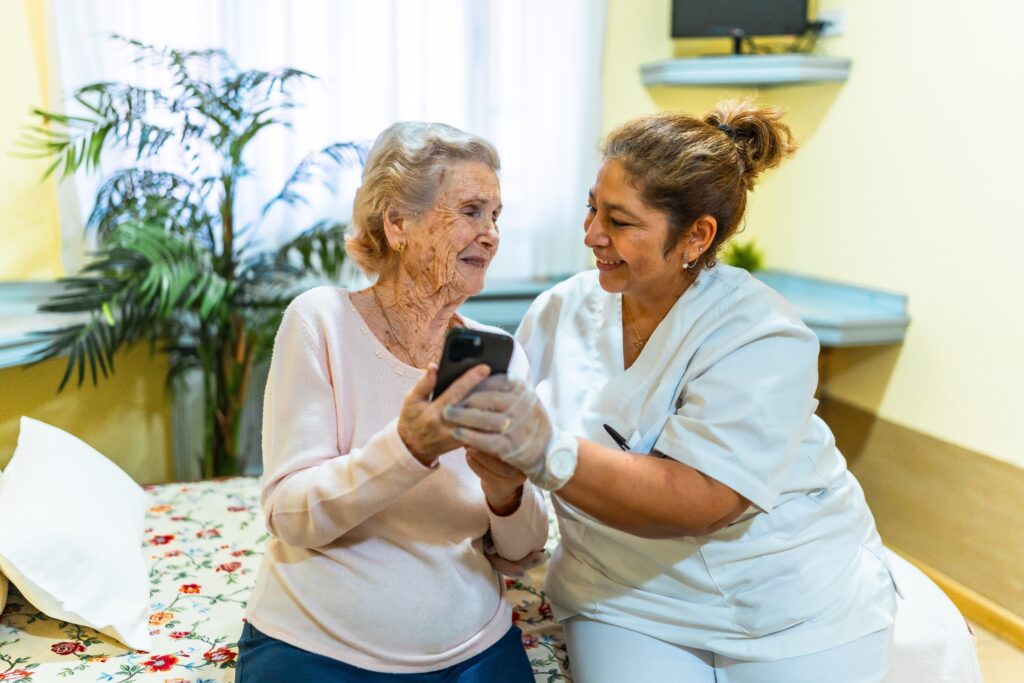
Photo credit: Shutterstock/Anna-Carina Nagel
References
AARP. (2021). Where we live, where we age: Trends in home and community preferences. https://livablecommunities.aarpinternational.org
Applebaum, R., Nelson, M., Dikhtyar, O., & Bowblis, J. (2025). Home- and community-based services in Ohio: 1993–2023. Scripps Gerontology Center.
Applebaum, R., Nelson, M., Straker, J. K., Harrington, A. K., Bowblis, J. (2020). Maybe you can go home again: Ohio’s strategy to provide long-term services and supports for a growing older population. Scripps Gerontology Center. https://sc.lib.miamioh.edu/bitstream/handle/2374.MIA/6685/Maybe%20You%20Can%20Go%20Home-Report.pdf
Brewster, D. J., Butt, W. W., Gordon, L. J., & Rees, C. E. (2020). Leadership in intensive care: A review. Anaesthesia and intensive care, 48(4), 266–276. https://doi.org/10.1177/0310057X20937319
Congressional Research Service. (2023). Older Americans act: COVID-19 Response [CRS report prepared for Members and Committees of Congress]. https://www.congress.gov/crs-product/R47602
Eiken, S., Sredl, K., Burwell, B., & Amos, A. (2018). Medicaid expenditures for long-term services and supports in FY 2016. U.S. Department for Health and Human Services, Centers for Medicare and Medicaid Services. https://www.medicaid.gov/medicaid/long-term-services-supports/reports-evaluations/index.html
Eiken S., Sredl K., Burwell B., & Saucier P. (2016). Medicaid expenditures for long-term services and supports (LTSS) in FY 2014: managed LTSS reached 15 percent of LTSS spending. U.S. Department for Health and Human Services, Centers for Medicare and Medicaid Services. https://www.medicaid.gov/sites/default/files/2019-12/ltss-expenditures-2014.pd
Kemper, P., Applebaum, R., & Harrigan, M. (1987). Community care demonstrations: What have we learned? Health Care Financing Review, 8(4), 87.
Kemper, P. (1988). The evaluation of the national long term care demonstration. 10. Overview of the findings. Health Services Research, 23(1), 161.
Lee, A., & Jarosz, B. (2017). Majority of people covered by Medicaid and similar programs are children, older adults, or disabled. PRB. https://www.Prb.Org/resources/majority-of-people-covered-by-medicaid-and-similar-programs-are-children-older-adults-or-disabled
Lee, C. (2022). Combined federal and state spending on Medicaid home and community-based services (HCBS) totaled $116 billion in FY 2020, serving millions of elderly adults and people with disabilities. KFF. https://www.kff.org/medicaid/press-release/combined-federal-and-state-spending-on-medicaid-home-and-community-based-services-hcbs-totaled-116-billion-in-fy-2020-serving-millions-of-elderly-adults-and-people-with-disabilities/
Mabli, J., Castner, L., & Shenk, M. (2020). Evaluation of the effect of the Older Americans Act Title III-C Nutrition Services Program on participants’ longer-term health care utilization. Mathematica. https://acl.gov/sites/default/files/programs/2020-08/NSPevaluation_longertermhealth.pdf
Medicaid.gov. (n.d.-a). Home & Community-Based Services 1915(c). U.S. Department for Health and Human Services, Centers for Medicare and Medicaid Services. https://www.medicaid.gov/medicaid/home-community-based-services/home-community-based-services-authorities/home-community-based-services-1915c/index.html
Medicaid.gov. (n.d.-b). Medicaid LTSS expenditures, fiscal year 1981–2014: LTSS historic expenditures US inflation adjusted [Data table]. U.S. Department for Health and Human Services, Centers for Medicare and Medicaid Services. https://www.medicaid.gov/medicaid/long-term-services-supports/reports-evaluations
Miller, N. A. (1992). Medicaid 2176 home- and community-based care waivers: the first ten years. Health Affairs, 11(4), 162–171. https://doi.org/10.1377/hlthaff.11.4.162
Nelson, M., Bowblis, J. R., Applebaum, R., & Dikhtyar, O. (2025). Nursing homes in Ohio: A profile. Scripps Gerontology Center.
Scripps Gerontology Center & Ohio Department of Development. (2024). Projections of Ohio’s Older Adult Population. Ohio-Population.org
Stepanczuk, C., Eckstein, M., Kachalia, A., Carpenter, A., & Wysocki A. (2024b). Medicaid Long-term services and supports use and expenditures by service category, 2019–2021. Mathematica.
Thomas, K. S., & Mor, V. (2013). The relationship between older Americans Act Title III state expenditures and prevalence of low‐care nursing home residents. Health Services Research, 48(3), 1215–1226. https://onlinelibrary.wiley.com/doi/abs/10.1111/1475-6773.12015
United States. Bureau of the Census. (1992). 1990 census of population and housing. Washington, DC: U.S. Dept. of Commerce, Economics and Statistics Administration, Bureau of the Census. https://www.census.gov/library/publications/1992/dec/cp-1.html Wysocki, A., Murray, C., Kachalia, A., Carpenter, A., & Stepanczuk, C. (2023). Medicaid Long term services and supports annual expenditures report federal fiscal year 2020. Mathematica. https://www.medicaid.gov/medicaid/long-term-services-supports/downloads/ltssexpenditures2020.pdf