Abstract
National Core Indicators–Aging and Disabilities (NCI-AD) is a national initiative that measures and strengthens long-term services and supports (LTSS) systems for older adults and people with disabilities. NCI-AD uses standardized, person-centered surveys to hear directly from people using LTSS and provider agencies, capturing outcomes related to quality of life, access, choice, and workforce stability. Data are used by states, researchers, and advocates to benchmark performance, monitor trends, improve services, and guide policy. Through transparent reporting, state-specific technical assistance, and data access, NCI-AD helps improve service delivery and workforce capacity for older adults and people with physical disabilities.
Key Words
older adults, people with disabilities, surveys, lived experience, quality, Medicaid, LTSS, OAA, quality improvement, state systems
Nearly 10 million people across the United States use long-term services and supports (LTSS), the vast majority of which are funded through Medicaid and delivered in home- and community-based services (HCBS; Chidambaram & Burns, 2023; Stepanczuk et al., 2024).
Over the past several decades federal LTSS policies have resulted in “rebalancing,” which shifts state and federal expenditures away from institutions and toward support of people in their homes and communities. LTSS includes a wide range of supports for older adults and people with disabilities that are intended to enhance their overall well-being. LTSS gives people the opportunity to remain in their homes and communities with aids such as in-home supports, environmental modifications, transportation, and other services that maximize their independence.
The use of LTSS is expected to at least double in the next 25 years (Houser, 2024). As LTSS demand rises, states have sought to measure the quality of supports they provide to older adults and people with disabilities. The need for more meaningful quality assurance is reflected in the 2014 HCBS Settings Rule, which requires states to collect and report data that demonstrate person-centered practices, participant choice and rights, and full access to the community. Subsequent rules have reinforced the value of person-centered systems and require data demonstrating these outcomes. To meet these federal policies, states need performance indicators to monitor individual and systemic outcomes.
Because HCBS are not clinical in nature, this system does not have the range of nationally recognized performance measures, such as the Healthcare Effectiveness Data and Information Set (HEDIS) (National Committee for Quality Assurance, 2025). Measuring the outcomes of HCBS are directly related to the value that these services add to individuals’ quality of life. Therefore, to help determine whether services meet people’s needs and goals, and to identify areas for quality improvement, it is important to listen to and learn from the lived experiences of people receiving LTSS. These experiences are the best source of information about the impact of services on people’s lives.
One of the more robust and comprehensive measurement initiatives used to capture participant experiences is National Core Indicators–Aging and Disabilities (NCI-AD). NCI-AD is designed to support state Medicaid, aging, and disability agencies to assess the performance of their programs and improve LTSS. Since 2015, in an effort to collect valid and reliable data in response to state needs, Human Services Research Institute (HSRI) and ADvancing States have partnered to administer the NCI-AD Adult Consumer Survey (ACS).
The tool provides state partners a comprehensive view of how publicly funded services impact the quality of life and outcomes of older adults and people with physical disabilities. The NCI-AD ACS was developed to focus on indicators such as community integration and person-centered services, among other valued outcomes. More recently, NCI launched the NCI State of the Workforce–Aging and Disabilities (SoTW-AD) to collect data from provider agencies on the workforce that supports those receiving services through state aging and disability systems.
States’ participation in NCI-AD surveys shifts from year to year depending on the state’s priorities and resources. Some states participate every year with consistent sample populations, others alternate years in which they survey populations (i.e., alternating waivers, managed care populations, regions or OAA programs), and others alternate participation years completely. States may choose to add state-specific questions at the end of the survey to dive deeper into a topic of interest. NCI’s customizability prioritizes the needs of states and individuals receiving services.
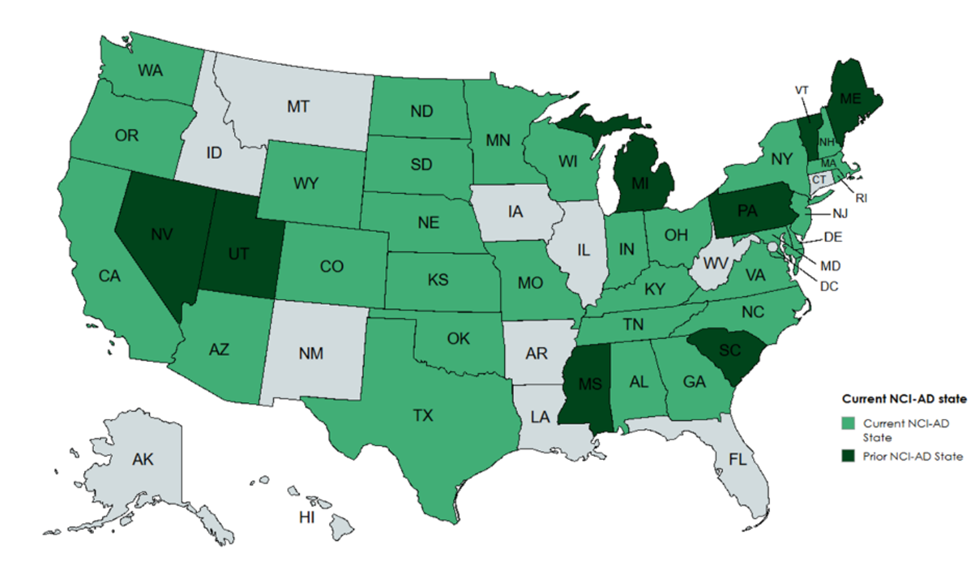
The following map shows current and previous NCI-AD state partners.
The national project team, comprising experienced staff from ADvancing States and HSRI, engages with state staff, researchers, advocates, and people with lived experience. The NCI team works to uplift the voices of people using services and the people who support them by applying valid and reliable measurement and tools and producing publicly accessible and transparent data.
Adult Consumer Survey Development
July 2025 marked one decade of NCI-AD. In the years since the ACS was launched in 2015, more than 100,000 people using publicly funded LTSS across 33 states have taken part in conversations about the quality of their services and lives. During that decade, 39 states participated in at least one ACS survey cycle. In the 2 years that the SoTW-AD has been circulated, important workforce data has been collected from 1,610 direct service providers. In the most recent data cycle alone, 88,855 direct service workers were represented.
The NCI-AD initiative grew from state aging and disability staff wanting quantifiable data on the experiences of people receiving publicly funded LTSS, and needing to know whether those services and systems were helping them achieve valued outcomes such as self-determination, access to the community, and satisfaction with home and daily activities. This voluntary effort by states led to the first national set of benchmarks in service delivery for aging and disability programs.
‘Most states conduct more than 400 surveys so they can make comparisons across programs or other groups.’
Since 1997, public managers of state agencies on intellectual and developmental disabilities (IDD) have been collecting similar outcome data through National Core Indicators–Intellectual and Developmental Disabilities (NCI-IDD), supported by a collaboration between the National Association of State Directors of Developmental Disabilities Services (NASDDDS) and the HSRI.
Development of the NCI-AD ACS began in 2012 using the NCI-IDD In-Person Survey as a foundation. To the extent possible, NCI-AD and NCI-IDD align across domains of interest to support cross-population comparisons. The national project teams meet regularly and collaborate on updates to ensure alignment.
The NCI-AD ACS was developed with support from a steering committee of 19 state departments providing aging and disability services. This committee helped to develop “indicators” or survey measures designed to assess system progress or performance that reflect the mission and the aims of state aging and disability systems. Steering committee members were asked to reflect on:
- Relevance—what are current state and federal priorities?
- Usability—what data can be used to address state priorities and measure systems change?
- Feasibility—what type of survey data can be effectively collected? Ensure the survey is not cost-prohibitive.
- Actionability—which types of data can be used by states to take remedial action when necessary?
The ACS went through multiple iterations as the NCI-AD project team engaged service users, researchers, and other experts in the field to provide feedback and testing. This helped to ensure content and face validity.
With guidance from the steering committee, researchers, subject matter experts, and people with lived experience, the NCI-AD project team developed a set of Survey Domains, or broad topics which measure important areas of service delivery. Under each Survey Domain there are sub-domains used to further examine areas of concern within domains. Each sub-domain includes a “concern statement” stating the aspirational system performance within that sub-domain. Table 1, below, shows the 20 sub-domains that provide the framework for the ACS.
Table 1. NCI-AD ACS sub-domains
| Community Inclusion | Choice and Control |
| Relationships | Satisfaction |
| Service Coordination | Care Coordination |
| Access to Community | Access to Needed Equipment and Modifications |
| Safety | Health Care |
| Wellness | Medications |
| Rights and Respect | Self-direction |
| Work | Everyday Living |
| Affordability | Access to Technology |
| Person-centered Planning (state optional) | Self-direction (state optional) |
Finally, indicators in each sub-domain represent ways in which that sub-domain’s value statement will be measured. To be included in NCI-AD, indicators must be:
- Reflective of the mission, vision, and values of public service agencies;
- Measurable;
- Practical to implement;
- Reliable and valid;
- Sensitive to changes in the system;
- Representative of issues the states have some ability to influence; and
- Reflective of outcomes that are important to all individuals served.
The final ACS includes more than 60 indicators that assess access, quality-of-life outcomes, community participation, and person-centered supports. A full list of ACS domains, sub-domains, and indicators can be found here.
Survey reliability was demonstrated through inter-rater reliability that showed a high level of agreement (Cohen’s Kappa > 0.80), indicating strong consistency in survey administration. The NCI-AD adult consumer survey is regularly reviewed by subject matter experts—including individuals who have lived experience with disability—to ensure its continued relevance and face validity.
How it Works
NCI-AD program staff work closely with each participating state to ensure valid and reliable data collection methods are employed, to provide guidance for successful survey completion, and produce annual data findings in an accessible format. The NCI-AD program staff also work closely with state staff to understand their data and implement quality improvement initiatives based on findings at the close of the survey cycle.
NCI-AD staff collaborate closely with states to understand their goals in surveying and help states develop sample strategies that meet their interests and needs. States select the LTSS programs from which to draw their sample for the survey, potentially including: HCBS Medicaid waivers, Older Americans Act (OAA), Money Follows the Person (MFP), Program for All-Inclusive Care for the Elderly (PACE), nursing facilities, and state-funded programs. Many states include multiple LTSS groups in their program samples to compare outcomes by program.
Each state attempts to complete 400 or more surveys. Completing 400 surveys guarantees valid comparisons can be made across states with a 95% confidence interval and a margin of error of +/- 5%. What this means is that a sample of 400 allows the state to be confident that the sample is representative of the population being surveyed. Most states conduct more than 400 surveys so they can make comparisons across programs or other groups. Several states choose to stratify their sample by managed care organizations (MCOs), Area Agencies on Aging (AAA), geography, or other grouping. In 2023–24, the median sample size across 20 participating states was 927.
NCI-AD has developed a standard surveyor training curriculum that must be completed satisfactorily by all surveyors prior to surveying in the field. Trained surveyors conduct the survey through in-person meetings, secure video meetings, or telephonic conversations with service participants. The main part of the survey contains subjective questions about how well the services a person gets support the person; these can only be answered by the person receiving services. A subset of more objective questions may be answered by a proxy respondent if needed.
Survey administration includes a process by which the surveyor determines whether a proxy is required to complete the survey on a person’s behalf. This process involves asking participants sample questions. If, based on the responses to the sample questions, the surveyor determines that the participant is unable to provide valid responses, a “Proxy Version” of the survey is used, and the surveyor conducts the survey with an individual who knows the person well. The Proxy Version of the ACS is limited to questions that are observable and/or measurable, and on which the proxy can reliably report. Proxy respondents are typically the person’s family but may also be staff or another person who knows the participant well. To avoid conflicts of interest, case managers are not allowed to respond as proxies. Further, if both the participant and a proxy participant answer a question, the participant’s answer is recorded as long as their answer is deemed reliable by the surveyor. Surveyors also keep track of who responds to each question—the participant or the proxy—and the proxy’s relationship to the participant.
‘One of the most common uses of these emergency funds was to pay family or legally responsible adults to provide support.’
In some instances, an NCI-AD participant requests to have a family member or caregiver present during the survey. If the participant does not require a proxy, but the family member or caregiver is attempting to respond to the questions on behalf of the person, surveyors are trained to ensure the participant’s response is recorded and remind the family members/caregivers of the importance of hearing directly from the person who uses services. Surveyors are trained to assume that the individual can answer questions on their own at the start of the interview and involve the person receiving services as much as possible throughout—even when a proxy is present.
In addition to questions for service participants, the survey also includes a Background Information section on the person’s demographic and service-related characteristics. Background information items are mainly drawn from service agency records. This information provides valuable context for those included in the data. These data, in combination with survey responses, can help determine whether characteristics such as where a person lives, the types of services they receive, type of conditions they have, and other factors may influence how they experience services.
Data Transparency
As part of their agreement to participate in NCI-AD, states agree to have their individual state-level data shown in national and state reports produced by the NCI-AD team annually. These reports are publicly available (www.nci-ad.org) at no cost. Data transparency is not only critical to supporting the goal of uplifting voices of people receiving services, but it also ensures all states and interested parties have access to state and national data that provides a reliable means of producing performance benchmarks and national norms. States make use of this data frequently in devising their individual quality strategies and creating benchmarks and goals for improving crucial and needed service delivery.
NCI-AD also makes de-identified data available to researchers. The research conducted using NCI-AD data helps inform national standards for policy and best practices. Recent research has focused on unmet needs, person-centered practices, outcomes among individuals with Alzheimer’s/dementia, and linking NCI-AD outcomes to other data sources (e.g., Medicaid claims).
Select Outcomes for the 2023–24 NCI-AD Survey Cycle
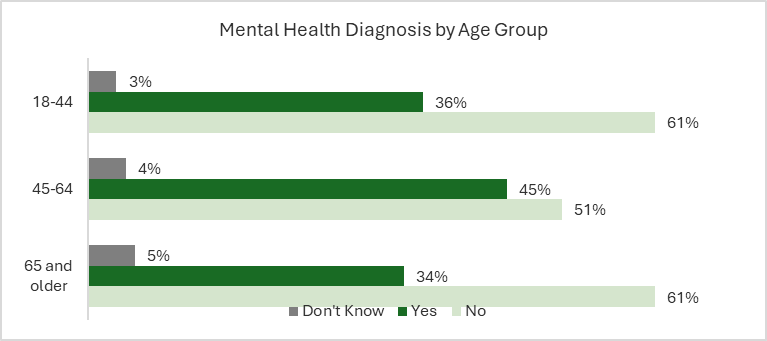
The latest available NCI-AD ACS data is from the 2023–24 survey cycle and includes the voices and experiences of more than 21,041 older adults and people with physical disabilities across 20 states. The average age of respondents was 62.5 years old; 12% were 18–44 years old, 33% were ages 45–65; most, 55%, were ages 66 or older. The majority of respondents identified as White (57%) or Black/African American (26%); 7% were Hispanic/Latino, 4% Asian, 3% American Indian/Alaska Native, and 3% were another race not listed. Just less than half (44%) were reported to have a physical disability, 12% had an Alzheimer’s or dementia diagnosis, and 10% had a traumatic brain injury. Just over a quarter of respondents had a mental health diagnosis (28%), as seen in Figure 1, below. This was most common among those ages 45–64.
Many states find their survey samples are representative of the population receiving LTSS in their state. Some states, however, may find that certain groups are under- or over-represented in survey demographic results. The NCI-AD project team works closely with states to create the most representative sample possible and address any discrepancies in representation.
Figure 1. Mental Health Diagnosis by Age Group
Transportation and Community
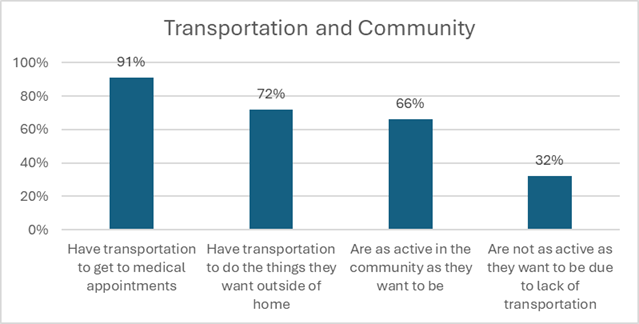
Supporting people to live and access their communities is a primary role of LTSS and is accomplished through providing various medical and non-medical services. Transportation is an important support that makes it possible for people receiving LTSS to participate in their communities. Figure 2, below, shows that while the majority (91%) of participants reported they have transportation to medical appointments, fewer than three quarters of participants reported they had reliable transportation to do things outside of their home when they wanted (72%). Sixty-six percent of respondents said they were as active in the community as they wanted to be. Transportation was one of the most cited reasons for 32% of respondents who were not as active as they would like to be. Access to transportation to do things in the community has remained consistent at just over 70% since the initial year of surveying in 2015.
Figure 2. Transportation and Community
Employment and Volunteering
Fewer than two thirds of respondents reported they typically like how they spend their day (63%), with those ages 45–64 tending to be least satisfied. The survey probes individuals about their preferences regarding community engagement, including volunteering and work. As shown in Figure 3, below, in 2023–24, 14% of respondents ages 18–45 reported they wanted to volunteer if they were not already, while 10% of those ages 45–64 and 6% of those ages 65 and older wanted to volunteer.
Compared to the desire to volunteer, similar rates of individuals ages 45–64 and ages 65 and older reported they wanted to work if they were not already employed (11% and 5%). More than one in five (22%) of those ages 18–44 reported they would like to work if they did not already. Importantly, fewer than half of those ages 18–44 who wanted to work reported someone talked with them about job options, with the rate of these conversations decreasing with age. These data suggest ample opportunity to improve person-centered planning conversations that include discussions regarding interest in working, volunteering, and otherwise determining how people wish to spend their day.
Figure 3. Employment and Volunteering
| Age Group | Likes how they usually spend the day | Volunteers | Does not volunteer, but wants to | Has job | Does not have a job, but wants one | Wants a job and talked with someone about job options |
| 18- 45 | 66% | 11% | 14% | 10% | 22% | 46% |
| 45-64 | 60% | 9% | 10% | 4% | 11% | 29% |
| 65 and older | 66% | 7% | 6% | 1% | 5% | 16% |
Caregivers
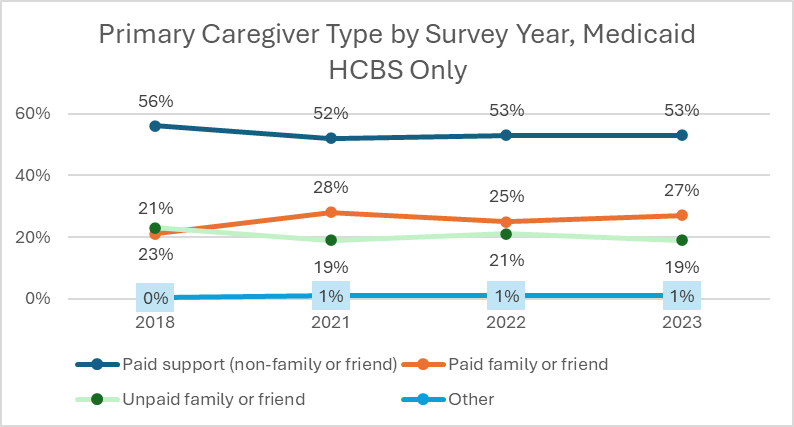
NCI-AD data allow states to understand how interventions and policies impact outcomes at the state and/or managing entity level by providing benchmarks for year-to-year tracking. Similarly, at the national level, data can help illustrate how changes in federal policy impact outcomes. During the COVID-19 pandemic, states were allowed to invoke emergency provisions through Appendix K of their 1915(c) HCBS waivers, and additional funding for emergency service provisions were made available to states through the American Rescue Plan Act (ARPA). One of the most common uses of these emergency funds was to pay family or legally responsible adults to provide support. The impact of this is seen in Figure 4, below, in NCI-AD ACS data trends where pre- and post-COVID data reveal an increase from 23% in 2018 to 28% in 2021 in the proportion of respondents using Medicaid HCBS whose primary support is paid family or friends.
Simultaneously, we see a decrease in traditional direct service workers (DSWs), down from 56% in 2018 to hovering just over 50% in subsequent years. We also see a relationship where, as rates of paid family and friends increase, unpaid family and friends decrease, and vice versa.
Figure 4. Primary Caregiver Type by Survey Year, Medicaid HCBS Only
State of the Workforce—Aging and Disabilities
Direct service workers (DSWs) are critical to ensuring that people receiving publicly funded LTSS have true access to choice, community engagement, relationships, safety, and supporting overall quality of life. The workforce supporting older adults and people with physical disabilities (also known as the AD population) has been experiencing challenges for many decades. However, there has historically been little standardized data to illustrate state and national trends in workforce shortages, workforce conditions, and uptake of strategies to increase retention and recruitment. We also know that the COVID-19 pandemic greatly exacerbated the workforce crisis.
To meet the critical need for data on the workforce supporting the AD population—including information on wages, benefits, retention, and turnover—ADvancing States and HSRI began piloting a State of the Workforce survey in 2022 with five states: Missouri, Washington, Colorado, Wisconsin, and Indiana. As with the NCI-IDD State of the Workforce (SoTW-IDD) survey launched in 2014, the Aging and Disabilities version collects data about the status of direct service workers (DSWs) working in provider organizations.
The SoTW-AD is an online survey of provider agencies supporting older adults and people with physical disabilities in residential, employment, day services, and other in-home or community inclusion programs. The survey captures information about wages, benefits, and turnover of the direct care professional workforce.
The first round of data collection for the SoTW-AD (Aging and Disabilities) began in summer 2023 and has been conducted annually since. The last cohort of participating states, collecting data reflecting the workforce in 2023, included: Colorado, Illinois, Indiana, Missouri, Oregon, and Wisconsin. The survey, based largely on the SoTW-IDD tool and shaped by state feedback, is a first-of-its-kind national and voluntary survey that canvasses critical workforce issues that impact workers and providers supporting older adults and people with disabilities receiving LTSS. The State of the Workforce survey aims to help states:
- Describe the characteristics of the DSW workforce.
- Measure challenges that impact workforce stability and identify areas for further investigation.
- Monitor improvements made through policy or programmatic changes that impact key areas such as turnover, tenure, and wages.
- Compare their state data to those of other states and the NCI-IDD average.
- Help understand cost efficiency of workforce development efforts.
State public managers are best positioned to use such data to make evidence-based policy decisions that can benefit providers, workers, and people receiving supports. Provider agencies can use the data to determine where recruitment and retention efforts can be targeted and to compare themselves to providers in their state and nationally. The utility and impact of this workforce data cannot be understated.
How NCI-AD Data Are Used
Data generated by NCI-AD offers important insights into the experiences of older adults and people with physical disabilities receiving LTSS, and the people who support them. This information can be used to drive quality improvement across public aging and disability systems. These data can help highlight areas where the system is working well and opportunities for quality improvement. Importantly, data reflects the influence of state and federal policies, meaning that data can be used to identify whether and how policy interventions impact outcomes.
ACS data can be used to identify whether there are differential outcomes among various sub-populations. One recent example includes research using ACS data that suggests the relationship of race and ethnicity on expressed unmet need (Chong et al., 2022; Fabius et al., 2024). Data may also be used to explore how factors like rurality, residential settings, and service delivery model impact outcomes.
States may develop samples by MCOs, AAAs, or other groupings, allowing managing entities to review their own performance and track progress toward improvement goals. ACS data also offers opportunities to identify best practices linked to positive outcomes. States participating in the ACS share best practices with peers and policy makers through quarterly community of practice meetings, national webinars, and at conferences, furthering collaboration on quality improvement.
These data also may be used to assess utilization and access to healthcare (including behavioral health), such as the rates of preventive care screenings, oral health needs, and prevalence of behavioral health diagnosis and access to needed care. These data can be reviewed at state and national levels and may be compared to general population outcomes. ACS data also address potential risk factors such as frequent falls, social isolation and loneliness, and feelings of safety. Combined with demographic and personal characteristics, these factors help identify individuals who are at risk, and initiatives that increase access to needed services and community engagement. NCI-AD data is frequently used to inform policymakers and policy development, but it may also be used in conjunction with existing policies and regulations.
‘Both the NCI-AD Adult Consumer Survey (ACS) and State of the Workforce (SoTW) surveys offer powerful information on measures such as frequency of turnover and its impact on individuals and providers.’
NCI-AD data can help measure compliance with federal rules, such as the HCBS Settings Rule and the Ensuring Access to Medicaid Services Rule (Access Rule). Many ACS indicators are aligned with the measures required for reporting. State aging systems may use ACS outcomes to meet the requirements of the 2024 Older Americans Act implementation guidance (Administration for Community Living, 2024), and requirements to measure performance toward stated goals. Similarly, these data have also been used to address state and national progress toward goals of person-centered delivery (Chong et al., 2024).
Both the NCI-AD ACS and SoTW surveys offer powerful information on measures such as frequency of turnover and its impact on individuals and providers. Together, these data make it possible to understand the personal impact of frequent turnover on choice, safety, and community access, and offer insights into best practices for recruiting and retaining a robust workforce.
In sum, NCI-AD can play a vital role in measuring how changes to service systems impact those being served. NCI-AD tools identify areas for quality improvement and progress toward those goals—with the aim of improving the lives of people using services and those who support them.
Looking Ahead
As NCI-AD heads into its tenth year, we look forward to continuing to support states, advocates, older adults, and people with disabilities who are receiving LTSS use data to improve quality and to address unmet needs. Of particular interest will be results from states that employ MCOs, ways state aging systems are incorporating NCI-AD outcomes in their state plans on aging and multi-sector plans, and the important role and outcomes supported by family caregivers.
SoTW-AD Findings of Interest
To examine the workforce in 2023, SoTW-AD collected data from 1,232 provider agencies representing 88,855 DSWs in six states (Colorado, Illinois, Indiana, Missouri, Oregon, and Wisconsin). The data for 2023 suggest some positive trends for the state of the DSW workforce that supports older adults and people with physical disabilities. It also provides meaningful comparisons against the direct support professional (DSP) workforce supporting individuals with IDD.
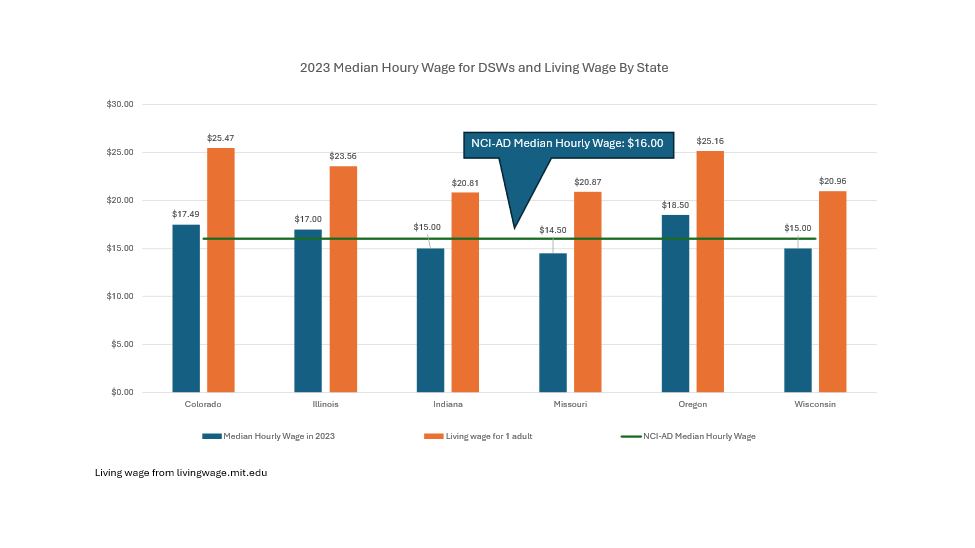
- Across the nation, the average hourly wage for DSWs is $16.27, with 97% of providers reporting wages above the state minimum wage. The average hourly wage for DSPs supporting adults with IDD was $17.20.
- The weighted average turnover ratio was 47.8%. Of the two states that also conducted the NCI-AD State of the Workforce survey in 2022, both states demonstrated a large decrease in turnover ratio.
- Across all six participating states, the percentage of providers who reported turning away or stopping accepting new service referrals in 2023 due to staffing issues was 28.8%. This is lower than the NCI-IDD average of 38.1%.
- When compared with providers supporting the IDD population, providers supporting the AD population are more likely to be private for-profit agencies, while IDD providers are more likely to be private nonprofit agencies.
- Private for-profit:
- Providers supporting IDD population: 59.0%
- Providers supporting AD population: 83.8%
- Private nonprofit:
- Providers supporting IDD population: 36.1%
- Providers supporting AD population: 11.8%
- Private for-profit:
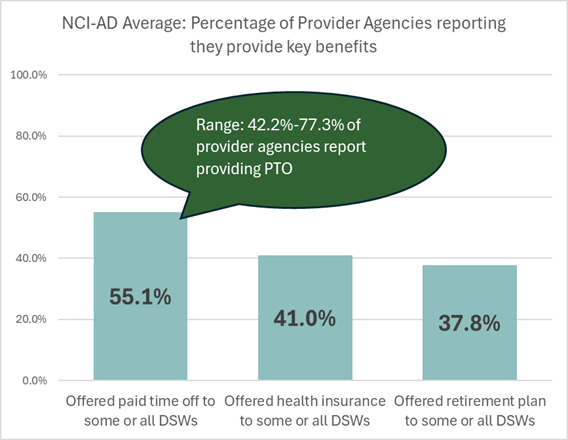
- The report reveals rates which AD providers in participating states offer benefits such as paid time off, health insurance, and retirement. In five out of six participating states, AD providers are less likely than IDD providers to offer paid time off to some or all DSWs. Across all participating states, 55.1% of AD providers offer paid time off to some or all DSWs, while 75.9% of IDD providers offer this benefit to some or all DSPs.
- The report also details recruitment and retention strategies in which provider agencies in participating states are engaged, such as realistic job previews, apprenticeship programs, training and credentials, bonuses, and more.
We look forward to future data collection cycles to better understand DSW retention and variables. With greater state participation and a more robust data set, we hope to inform state policy development and solutions that address DSW staffing shortages.
Courtney Priebe, MPH, is a policy associate at ADvancing States in Arlington, VA. Stephanie Giordano, PhD, is the Co-Director of National Core Indicators at Human Services Research Institute (HSRI) in Cambridge, MA. Rosa Plasencia, JD, is the Senior Director of National Core Indicators-Aging and Disabilities (NCI-AD) at ADvancing States. Lindsey DuBois, PhD, is a research associate at Human Services Research Institute (HSRI) in Cambridge, MA.
Photo credit: Shutterstock/MMD Creative
References
Administration for Community Living. (2024). Older Americans Act: Grants to state and community programs on aging; grants to Indian tribes and Native Hawaiian grantees for supportive, nutrition, and caregiver services; grants for supportive and nutritional services to older Hawaiian natives; and allotments for vulnerable elder rights protection activities, 89 F.R. 11566 (proposed February 14, 2024) (codified at 45 C.F.R. 1321-1324). https://www.federalregister.gov/documents/2024/02/14/2024-01913/older-americans-act-grants-to-state-and-community-programs-on-aging-grants-to-indian-tribes-and
Chidambaram, P., & Burns, A. (2023, August 14). How many people use Medicaid long-term services and supports and how much does Medicaid spend on those people? KFF. https://www.kff.org/medicaid/issue-brief/how-many-people-use-medicaid-long-term-services-and-supports-and-how-much-does-medicaid-spend-on-those-people/
Chong, N., Akobirshoev, I., Caldwell, J., Kaye, H. S., & Mitra, M. (2022). The relationship between unmet need for home and community-based services and health and community living outcomes. Disability and Health Journal, 15(2), 101222. 10.1016/j.dhjo.2021.101222
Chong, N., Caldwell, J., Kaye, H.S., & Mitra, M. (2024). Outcomes of person-centered planning in Medicaid home- and community-based services. The Gerontologist, 64(6), 1–11. 10.1093/geront/gnae017
Fabius, C. D., Parikh, R., Wolf, J. M., Giordano, S., Fashaw-Walters, S., Jutkowitz, E., & Shippee, T. (2024). Racial and ethnic differences in unmet needs among older adults receiving publicly-funded home and community-based services. Journal of the American Geriatrics Society, 72(11), 3250–3529. https://doi.org/10.1111/jgs.19153
Houser, A. (2024). Most Americans will need long-term services and supports in their lifetimes; many will face economic hardship as a result. AARP Blog. https://ltsschoices.aarp.org/blog/americans-need-ltss-will-face-hardships
National Committee for Quality Assurance. (2025). HEDIS measures and technical resources. https://www.ncqa.org/hedis/measures/
Stepanczuk, C., Carpenter, A., Murray, C., & Wysocki, A. (2024). Medicaid long-term services and supports users and expenditures by service category, 2022 [Report prepared forU.S. Department of Health and Human Services, Centers for Medicare & Medicaid Services]. Mathematica. https://www.mathematica.org/publications/medicaid-long-term-services-and-supports-users-and-expenditures-by-service-category-2022