Abstract
Older Americans Act (OAA) requirements require states to monitor service quality across nutrition, caregiving, emergency preparedness, and service delivery. This article highlights how the National Core Indicators–Aging and Disabilities (NCI-AD) Adult Consumer Survey (ACS) can support OAA compliance and program improvement using 2023–2024 data from five states. Survey results show heavy reliance on unpaid caregivers, lower reports of consistently getting needed support than Medicaid HCBS peers, and gaps in food security and emergency planning.
Key words
NCI-AD, Older Americans Act (OAA), home- and community-based services (HCBS), family caregivers, nutrition, emergency preparedness
On February 14, 2024, the Administration for Community Living (ACL) released updated Older Americans Act (OAA) requirements, which became effective May 15, 2025. The OAA provides supports and services to help older adults live independently in their homes and communities. Updates include expanding and clarifying requirements related to service eligibility and delivery, nutrition, caregiver support, and emergency preparedness (ACL, 2024). Importantly, states are now required to collect data to monitor the quality and effectiveness of service delivery.
First launched in 2015, the National Core Indicators–Aging and Disabilities (NCI-AD) Adult Consumer Survey (ACS) is a comprehensive survey conducted with older adults and people with physical disabilities who use state-funded long-term services and supports (LTSS), including those using OAA services. The ACS includes more than 60 indicators of individuals’ experience accessing and using services and supports, as well as quality of life. Several indicators are used to inform state plans on aging and multisector plans, as shown in Figure 1, below.
Figure 1. Sample ACS Questions by Common State Plan and MPA Goals
| Common State Plan and MPA Goals | NCI-AD ACS Indicator |
| Access to Services and Supports | Gets enough support for everyday activities (if needs at least some assistance)Services and supports help them live the life they want |
| Health, Wellness, and Nutrition | Has worked with someone to reduce risk of falls (if someone has concerns about them falling or being unstable)Ever has to skip meals due to financial worries |
| Emergency Preparedness and Safety | Has an emergency plan in place in case of wide-scale emergencyKnows who to talk to if they are mistreated, hurt, or disrespected by others |
| Workforce and Caregiving | Paid support staff change too oftenHas a backup plan if people who are paid to help them do not show up |
| Community Access and Participation | Takes part in activities with others as much as they want to (in-person or virtually)Has transportation to do the things they want outside of home |
The updated OAA requirements identify additional populations that meet need-based criteria for service targeting (ACL, 2024). OAA services can help people with the greatest need stay in their homes and retain access to their communities. By providing supports like meals, transportation, and caregiver support, such services also act as an important stopgap to delay or prevent higher-level care (Thomas & Mor, 2013).
An increasing number of states are including people using OAA services in ACS surveys, especially when used in combination with Medicaid populations. This can strengthen states’ understanding of the experiences of those groups distinctly and improve quality of services delivered. Many states survey enough people within Area Agencies on Aging (AAA) to make statistically sound estimates of outcomes, offering a more detailed understanding of service quality and benchmarks to help states and AAAs mark progress toward quality improvement goals.
‘The vast majority (60%) of OAA respondents relied upon unpaid family or friends as their primary support.’
The data below are from the 2023–2024 NCI-AD ACS data collection cycle. Five states included OAA programs, and we spotlight outcomes of OAA participants compared to Medicaid HCBS users who were ages 60 and older (referred to below as “HCBS Medicaid”). Differences between these groups, described below, are statistically significant at a significance level of .01, meaning the differences we see are likely not due to chance.
Family Caregivers
The new OAA requirements clarify available National Family Caregiver Support Program services, such as educational resources, counseling, respite, and other supplemental services (ACL, 2024).
In 2023–2024, 63% of OAA respondents reported receiving help on a regular basis. Among those, the vast majority (60%) relied on unpaid family or friends as their primary support, a rate more than 3 times higher than HCBS Medicaid users (17%). A third of OAA respondents received assistance from paid support workers who were not relatives or friends, and just 3% were supported by paid family or friends compared to 26% of HCBS Medicaid users. One third of OAA respondents said they had additional support, and unpaid family or friends accounted for 51% of those additional supporters.
Support Need and Access
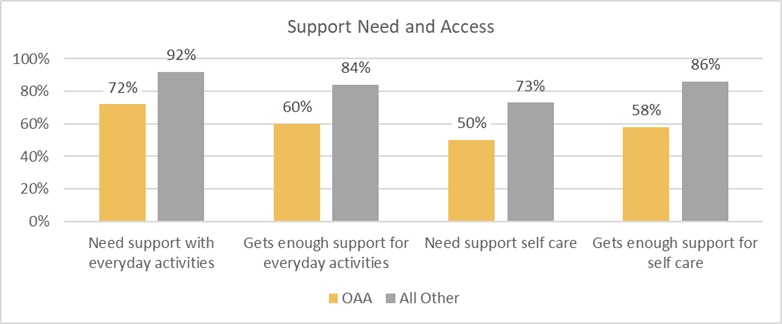
As shown in Figure 2, below, OAA respondents had lower rates of self-reported support needs for everyday activities and self-care compared to HCBS Medicaid users. While OAA respondents reported lower care need, they also reported lower rates of always getting the support needed for everyday activities (60% vs. 84%) and self-care (58% vs. 86%). Fewer OAA respondents reported that services met their needs and goals (61% vs. 76%).
Figure 2. Support Needs and Access OAA vs. Medicaid HCBS Users Ages 60 and Older
Nutrition
The new OAA requirements expand nutrition service guidelines to allow Title III C-1 funds to be used for “grab and go” meals, update home-delivered meal eligibility, and allow Title III C-1 and C-2 funds to be used for nutrition education and education counseling services (ACL, 2024). Title III C-1 and C-2 are nutrition programs that provide meals and nutrition to older adults, including both congregate and home-delivered meals.
A slightly (but significantly) higher rate of OAA respondents compared to ACS HCBS Medicaid respondents reported having to skip meals due to financial concerns (13% OAA vs. 10% HCBS Medicaid). Eighty-three percent of OAA respondents indicated they had access to healthy food when desired; this was significantly fewer than the 88% of HCBS Medicaid users who reported this access.
Expanded eligibility for meal delivery and funding flexibility increases states’ ability to provide much needed nutrition services to older adults. As these policies are implemented, states can use NCI-AD to track perception of food security.
Allocations for the OAA Nutrition Service Incentive Program (NSIP) are based on the number of meals reported by the state that meet certain requirements. NSIP meal reporting also requires states to report on meals provided to eligible family caregivers. States can track whether increases in meals correspond to greater food security and access to healthy foods. States can also use NCI-AD data to look at geography and other factors that may impact food access.
Emergency Preparedness
The new OAA requirements mandate that states establish minimum emergency plans, including coordination with AAAs, local emergency management, and other appropriate local entities (ACL, 2024).
‘Georgia has seen an increase in the percentage of respondents who report they can access healthy foods, from 73% in 2018 to 85% in 2023.’
OAA respondents reported being able to get to safety quickly in an emergency at lower rates than HCBS Medicaid users (81% vs. 88%) and were less likely to report having an emergency plan in place (69% vs. 79%). These differences may be a reflection on the relative residential setting, meaning some OAA participants are more likely to live in their own home or with family, and others are more likely to live in group settings. These data suggest a need for important conversations with OAA participants about safety measures and emergency planning. State emergency plans should leverage older adults’ community resources to increase the number of OAA recipients who have emergency plans and are able to reach safety in an emergency.
Information About Services
Most OAA survey respondents reported they were informed about the services and supports they are using through healthcare providers (19%), state and county agencies (16%), AAAs, or Aging and Disability Resource Centers (ADRCs) (16%). This underscores the importance of community engagement for older adults and highlights the valuable role OAA-funded agencies play in helping individuals live independently and age with dignity in their homes and communities.
Data Use
Twenty states’ data was published in the 2023–2024 NCI-AD ACS report. The data reflect the voices of 21,043 older adults and people with physical disabilities using LTSS. Among those, 1,687 were OAA participants across five states.
States use NCI-AD data to refine, expand, and improve LTSS programs, including OAA services, to better meet the needs, preferences, and goals of people using services in that state. An important feature of the ACS allows states to add their own questions to the end of the standard survey. These customized questions can help to better assess relevant priorities in the state, including the quality of OAA programs, and track progress toward quality improvement goals. States use state-specific questions in a variety of ways, and these questions change over time to reflect the needs and priorities of the people they serve. These improvements can increase efficiency and efficacy of service delivery and improve outcomes for older adults.
State Examples
In addition to the core survey questions, states may tailor their surveys by surveying optional populations—such as OAA participants—and asking custom state-specific questions. Below, we highlight two states and how they use the data they collect to improve quality related to the OAA.
Georgia
Georgia’s aging division has participated in NCI-AD since 2015. The Georgia Division of Aging Services (DAS), the state unit on aging, serves roughly 40,000 individuals through its OAA programs, and the division highly values the ability to assess participants’ experiences with these programs. Since 2015, 3,941 individuals receiving LTSS have been surveyed in Georgia, including 501 individuals in the 2023–2024 survey cycle.
In previous years, Georgia DAS added nutrition-specific questions to the ACS to demonstrate the importance and benefit of nutrition programs for older adults. Since adding these questions, there has been an increase in the percentage of respondents in Georgia who report they can access healthy foods, from 73% in 2018 to 85% in 2023.
Additional questions have been added to Georgia’s survey to assess dental health and establish dental assistance partnerships. In the past 2 years, the focus of DAS’ state-specific questions has shifted from nutrition to dementia. DAS seeks to combine self-reported dementia data with its NCI-AD ACS findings to get a more comprehensive view of this population and its experiences. Georgia DAS is particularly interested in identifying any regional differences in client experience.
Using NCI-AD results, DAS can compare Georgia’s performance to other states, advocate for older adults in the state, and request funding from the state legislature. NCI-AD ACS has proven to be a valuable tool to show year-over-year improvement, as well as identify trends in unmet need. DAS is conducting a longitudinal study of its OAA population to identify areas of and need among these program participants.
Georgia’s long-standing use of NCI-AD demonstrates how thoughtful implementation of state-specific questions and data use can inform strategic decision making, advocate for resources, and support innovative service delivery models—particularly in critical areas such as nutrition, dental health, and dementia care.
North Carolina
The 2024–2025 survey cycle was the North Carolina Division of Aging’s first year implementing the NCI-AD ACS. The Division of Aging plans to use NCI-AD data to inform the state’s multisector plan on aging (MPA), develop a data dashboard, shape outcomes, track progress, and inform decision making. NCI-AD OAA data will inform service delivery and quality improvement efforts in the state, tracking progress over time.
North Carolina is taking an innovative approach to engaging with its aging network. The Division of Aging stratified NCI-AD data by AAA to compare regional outcomes. Additionally, they gathered feedback from interested parties through a survey administered to each AAA, identifying which ACS indicators they will prioritize for year-over-year quality improvement efforts.
In the upcoming survey cycle, the North Carolina Division of Aging will also conduct the NCI-AD State of the Workforce (SoTW) survey. The goal is to gain deeper insights into the direct care workforce and support enhanced interagency collaboration, ultimately improving outcomes for the populations served. The proactive approach in North Carolina, even in its first year of participation, shows the versatility of NCI-AD in supporting broader aging initiatives, identifying service gaps, and improving staffing.
Conclusion
As states work to implement the expanded OAA requirements, tools like NCI-AD are proving invaluable for collecting meaningful data, monitoring service quality, and driving continuous improvement. By leveraging the lived experiences of older adults, states can gain deeper insights into the effectiveness of their programs and ensure that services are responsive to participant needs and goals.
Courtney Priebe, MPH, is a policy associate and Kendall Lynch is a junior policy associate, both at ADvancing States in Arlington, VA. Stephanie Giordano, PhD, is co-director of National Core Indicators at Human Services Research Institute (HSRI) in Cambridge, MA. Rosa Plasencia, JD, is senior director of National Core Indicators-Aging and Disabilities (NCI-AD) at ADvancing States. Lindsey DuBois, PhD, is a research associate at HSRI.
Photo credit: Shutterstock/MSMStudio
References
Administration for Community Living. (2024). Older Americans Act: Grants to state and community programs on aging; grants to Indian Tribes and Native Hawaiian grantees for supportive, nutrition, and caregiver services; grants for supportive and nutritional services to older Hawaiian natives; and allotments for vulnerable elder rights protection activities, 89 F.R. 11566. https://www.federalregister.gov/documents/2024/02/14/2024-01913/older-americans-act-grants-to-state-and-community-programs-on-aging-grants-to-indian-tribes-and
Thomas, K. S., & Mor, V. (2013). The relationship between older Americans Act Title III state expenditures and prevalence of low-care nursing home residents. Health Services Research, 48(3), 1215–1226. https://doi.org/10.1111/1475-6773.12015