Abstract
Workers who become disabled may need some level of home care, such as help with dressing, bathing, cooking, or shopping. Family members usually provide this care, but it may come at a cost to households facing economic precarity. This article describes the situation of older workers who experience work-limiting disability, their need for home care, and their sources of care. Unmet needs are widespread, but fluctuations are common. Federal benefit systems and healthcare systems could be better designed to accommodate frequently shifting circumstances.
Key Words
Social Security, disabilities, caregiving, home care, poverty, unmet needs
When a person must stop work because of a disability, Social Security Disability Insurance (SSDI) and Supplemental Security Income (SSI) are designed to provide crucial income support and healthcare coverage. These programs do not necessarily cover support for personal care needs, such as help with dressing, bathing, cooking, or shopping. That care is usually provided by family members or friends. It may be lovingly offered, but it can come at a cost to the household’s economic security.
Disability can happen to anyone, but poverty plays a role. Over the years, structural disadvantages can accumulate: A lack of educational opportunities translates into low-paying, low-control, physically demanding work, often without benefits. Inadequate nutrition, untreated health problems, and neighborhoods with more pollution and less green space contribute to the risk of disability. Financial strain and racial discrimination can cause long-term stress, which affects health directly and through negative health behaviors (Carr, 2019).
Even before SSDI entry, beneficiaries are more likely to be in poorer health, to have less education, and to work in less skilled, lower paying occupations than those who remain in the workforce; after disability, financial stability and family support may decline (Livermore et al., 2009). SSI beneficiaries are more likely than working-age adults in general to be single Black or Hispanic women and to lack a high school diploma; these are all predictors of lower earnings or household income, as well as disability (Goyat et al., 2016; Social Security Administration, 2018; Women’s Bureau, 2024).
While the individual and household cope with a loss of income, there may also be a need to arrange home healthcare or help with daily activities. A spouse may need to increase earnings while at the same time providing care, a teenager may juggle caregiving with schoolwork, or the individual may need to hire a personal care aide. Economists find, for example, that women typically reduce their employment and see a decline in earnings in response to caregiving demands (Maestas et al., 2024). Not enough is known about the tradeoffs families make when disability occurs.
Based on quantitative data, this article describes the situation of adults ages 50 to 64 who experience work-limiting disability, their need for home care, and their sources of care. It also considers how SSDI and SSI program structures might better mitigate disadvantage in older workers who have disabilities. Our research, initially funded by the Social Security Administration, included a plan to interview family members about the tradeoffs they make. Funding ended in February 2025 with a stop-work order, before the interviews could be conducted. Nevertheless, the quantitative data reveals a significant level of unmet needs.
How SSDI and SSI Differ in Structure and Benefits
Both SSDI and SSI provide benefits when an individual has a disability that is expected to last at least a year or result in death, but they are fundamentally different programs. As disability insurance, SSDI is funded through the Social Security payroll tax. To be eligible for benefits, an individual must have a certain duration of covered work; for a 50-year-old, the duration is 7 years, including at least 5 out of the 10 years preceding the disability. The benefit amount depends upon past earnings but has a limit of about $4,000 per month; the average monthly benefit in 2022 for disabled workers was $1,486 (KFF, 2025). Beneficiaries also are limited in the amount they can earn through work and still be considered disabled, but there is no restriction on assets. At full retirement age, SSDI converts into Social Security retirement benefits.
SSI, by contrast, is paid through U.S. Treasury funds. It is a subsistence program for people who are blind, have disabilities, or are ages 65 and older, and who have a very low income (about $2,000/month for an individual, or $3,000/month for a couple) and almost no assets. The maximum monthly benefit is about $1,000 for an individual or $1,500 for a couple; the U.S. average for SSI beneficiaries younger than age 65 in 2022 was $644 (KFF, 2025). About 12% of SSDI beneficiaries are also enrolled in SSI (KFF, 2025).
‘The U.S. average for SSI beneficiaries younger than age 65 in 2022 was $644.’
The application process for SSDI or SSI can stretch on for several months, and if the applicant is denied and appeals the decision, the period sometimes goes on for years. Once approved, SSDI benefits are retroactive to 5 months after disability onset. SSDI beneficiaries are eligible for Medicare two years after that. In the meantime, some face months without health insurance. Medicare does not cover home health and personal care except for homebound individuals needing skilled care. SSI recipients are immediately—though not always automatically—eligible for Medicaid, which covers institutional long-term care and, to some degree, home health services.
Beneficiaries of both programs are expected to report any changes in their disability or work status, including job duties, hours, or pay. SSI beneficiaries are expected to report any wages every month, as well as changes to their bank balances, help paying bills, and changes in household composition. SSDI/SSI recipients may expend considerable effort on bureaucratic demands. Beneficiaries in California have reported different Social Security Administration (SSA) representatives requiring different information and said they “felt that they could never satisfy SSA rules” (Savin, 2019). The precarity involved in proving one’s status on the right (wrong) side of the employment/disability line mirrors the precarity of the labor market for a low-income worker with a disability. Finding a steady source of income jeopardizes benefits, even if that source of income isn’t sufficient to survive.
The Health and Retirement Study Shows Stark Differences
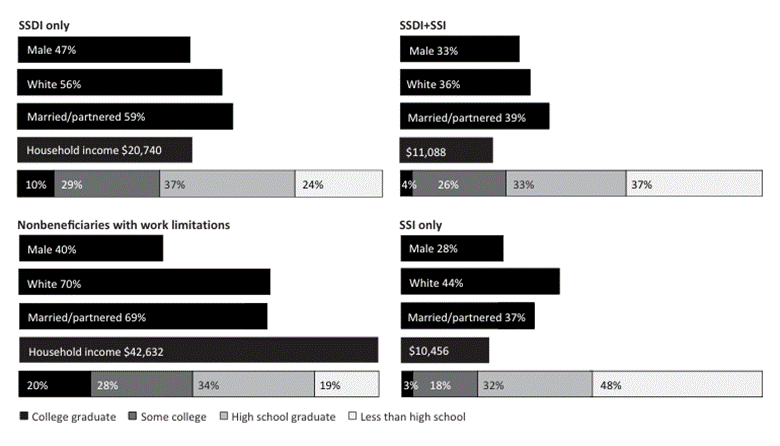
To examine the differences between home care needs and assistance among beneficiaries of SSDI, SSI, or both, and nonbeneficiaries whose health limits their ability to work, we used data from 21 years (2000–2022) of the Health and Retirement Study (HRS), a longitudinal survey of Americans ages 50 and older. We grouped participants ages 50 to 64 at the first interview wave when they were disability beneficiaries or reported health limiting their ability to work. As expected, the groups differed in several demographic domains (see Figure 1, below).
Figure 1. Disability Beneficiaries Show a Profile of Disadvantage

Source: Authors’ analysis of data from the Health and Retirement Study (2000–2020).
As shown in Figure 1, the group receiving SSI only and the group receiving SSDI and SSI display stark profiles of disadvantage. The two groups were mostly female and unmarried, with lower levels of education. Women face a gender gap in wages, and they may have fewer full-time years in the workforce because of child-care responsibilities, making it harder to accumulate the Social Security work years necessary to be eligible for SSDI (Fry & Aragão, 2025).
Median household income for the SSDI-only group was almost twice as high as SSI income, probably attributable to a higher level of education and higher percentages of men and couples. The nonbeneficiary group reporting work limitations somewhat resembles the SSDI-only group, but with a higher proportion married and the highest education levels and highest income. Nearly half were working for pay, compared with less than 10% of the SSDI/SSI beneficiaries (not shown). Those who were not employed may have relied on a spouse’s income to avoid applying for disability benefits.
Sources of Care and the Role of Medicaid
We define caregiving as providing help with activities of daily living (ADLs), such as bathing, dressing, and eating, or instrumental ADLs (IADLs), such as cooking, cleaning, and managing finances. Because of program and population differences, SSDI and SSI beneficiaries who need assistance with daily tasks may use paid and unpaid care to different degrees. SSDI-only beneficiaries are better off financially, but because Medicare’s home-care benefit is very limited, they may have to pay out of pocket if help beyond the family is needed. At $17 to $26 per hour, home-care costs add up quickly. SSDI beneficiaries may be more able than SSI beneficiaries to rely upon spousal care. SSDI payments have been found to reduce the probability that a spouse works by 12%, as the need for caregiving overrides the need to replace income (Lee, 2020; Rennane, 2020).
For SSI beneficiaries, Medicaid eligibility provides a potential pathway to paid care. In 2022, Medicaid paid for 61% of long-term services and supports in the United States—about $255 billion. The growth of Home- and Community-Based Services (HCBS)—home health aides, personal care aides, day programs, and housing and employment services—has been encouraged because they are less expensive than institutional care; HCBS now account for more than half of Medicaid long-term care spending (Chidambaram & Burns, 2024).
Some assistance can be the difference between being able to work and remaining isolated and idle.
Yet Medicaid enrollment does not guarantee access to home care. Medicaid is administered by states, and service rules vary. Because most home care is not mandated by Medicaid, states may reduce spending on these services when facing Medicaid funding cuts (Forden and Ghilarducci, 2025). Even if the state deems a person eligible, services may be scarce due to labor shortages and lack of provider capacity, especially in rural areas. Medicaid’s consumer-directed care programs offer another option, paying a caregiver of the recipient’s choice, including family members or friends (spouses are not eligible in some states). In this way, SSI greatly increases the probability that children are paid for their help, reducing their need to juggle care and work. Yet states may have a limited budget for such programs and may not accept all applicants. SSI’s limits on household income and in-kind support could also affect informal care decisions, by discouraging spousal employment or by discouraging coresidence with an adult child.
Home Care Needs and How Families Meet Them
In our research, the group eligible for both SSDI and SSI had the largest share with ADL difficulties (58%, compared with half of the other beneficiary groups), but they had a high level of insurance coverage (94%), with many enrolled in Medicare and Medicaid (see Figure 2, below). Six out of ten SSDI-only beneficiaries were covered by Medicare; some may have been in the waiting period, but others were covered by private insurance. Despite reporting work limitations, most of the nonbeneficiary group reported no ADL or IADL difficulties, but fewer than two-thirds were insured, primarily by employer-based or other private insurance. (Because the data spans 2000 to 2020, many observations precede the Affordable Care Act and Medicaid expansion; coverage is higher in recent years.)
Figure 2. Insurance Status Among Disability Beneficiaries and Nonbeneficiaries with Health Limitations

Source: Authors’ analysis of data from the Health and Retirement Study (2000–2020).
Unmet care needs were widespread (see Figure 3, below). Among those with any ADL or IADL difficulties (61% of beneficiaries and 31% of nonbeneficiaries), beneficiaries reported an average of 2 kinds of ADL difficulties and nonbeneficiaries 1.5, but all groups reported getting help with less than half of them. Respondents received help with about three quarters of the IADL needs reported.
Figure 3. Average Number of ADL/IADL Difficulties Among Respondents Reporting at Least One, and the Number They Receive Help With

Source: Authors’ analysis of data from the Health and Retirement Study (2000–2020).
Unpaid family members provided the majority of care, as expected, but the proportions differ by beneficiary group. Asked about person-hours of care in the past month, SSDI-only beneficiaries and nonbeneficiaries reported receiving more than 9 hours of unpaid care for 1 hour of paid care; for SSI-only beneficiaries, the ratio was about 8 to 1; and for SSDI+SSI beneficiaries, the ratio was about 4 to 1. Ratios of family care to nonfamily care were similar to unpaid/paid for SSDI only and SSDI+SSI, but the ratio was much higher for SSI only (12 to 1) and lower for nonbeneficiaries (6.5 to 1). In other words, SSI-only beneficiaries appear to have received a significant portion of paid care from family members, perhaps through the Medicaid person-directed care model. Among nonbeneficiaries, the numbers go in the other direction, suggesting that they received a somewhat greater proportion of unpaid help from friends or neighbors than the other groups, as well as being the least reliant upon paid care.
When help is not available, what do people do? Qualitative research is needed to understand how individuals manage—with equipment or simply with ingenuity. After a stroke, a participant in another study described, “just trying to do the things you used to do, and if it doesn’t work out, it doesn’t work out. Then you try to do it in a different way” (Satink et al., 2016). Adapting may involve higher costs: for example, paying more for prepared food if it’s hard to shop and cook. If getting out of bed and getting dressed is very difficult, an individual may not do it every day. That kind of assistance can be the difference between being able to work and remaining isolated and idle. The consequences of unmet needs are an important subject for research.
Fluctuations Are the Rule in Disability and Poverty Conditions
The statistics presented above indicate that Medicaid helps SSI beneficiaries with health insurance and paid care, which SSDI beneficiaries may lack. But these statistics represent a moment in time for survey respondents. Lived trajectories are not linear. Health, employment conditions, and sources of income shift. Care needs and sources of care change according to other demands on family time, such as job opportunities, child-care responsibilities, sickness, death, and all manner of tradeoffs that families must make.
Changes in the number of ADL and IADL difficulties reported from one survey wave to the next, two years later, are common—and they decrease as often as they increase. Out of 5,199 who reported an ADL difficulty between 2000 and 2020, 3,079 (59%) reported both an increase and a decrease in the number of difficulties, sometimes several, over the course of the study period. IADL difficulties show similar fluctuations. Individuals also reported fluctuations in the receipt and source of care. Four out of five reported starting and stopping a category of care: for example, of the 3,925 who received unpaid care in at least one study wave, 3,167 stopped unpaid care at least once. Disability beneficiaries may need financial and care help months before Social Security benefits kick in, but not necessarily forever.
‘Federal benefit and healthcare systems are generally not designed to accommodate frequently shifting circumstances.’
Unfortunately, federal benefit and healthcare systems are generally not designed to accommodate frequently shifting circumstances. Having to contend with the demands of the system at the same time one is coping with financial or personal emergencies—or even life improvements—presents an additional challenge. SSI beneficiaries must continually justify their receipt of benefits (Savin, 2019). Failure to report changes in income, health, or household composition can result in benefit reduction of $25 or more; false statements or “knowing” omission of information can result in suspension of payments (Social Security Administration, 2025). Herd and Moynihan (2025) provided a useful framework—administrative burden—to think about the barriers people face when trying to get and keep public benefits. Those who need help the most often face the biggest challenges due to the limited resources they have to navigate the system. By understanding these barriers, policymakers and practitioners can find better ways to make public services work for the people they are meant to support.
SSDI and SSI include work incentives designed to support beneficiaries who return to employment. These include limited periods where earnings above the usual thresholds are allowed, extended access to Medicare, temporary pauses on disability reviews, and additional support for those attempting to reenter the workforce. These programs, however, come with restrictions. They don’t allow SSI beneficiaries to build the financial cushion they need to handle setbacks or seize opportunities.
What Would a More Flexible Disability Support System Look Like?
It is difficult to escape the sense that the SSI program comes with a social-norm assumption (not one backed by research) that beneficiaries want to avoid work. The reality is that conditions causing disability grow worse but also better. Beneficiaries may find ways to adapt and want to return to work. Despite antidiscrimination laws, however, having a disability, coupled with being an older worker, could make it hard to get hired—especially for people of color without a college degree. Moreover, the episodic nature of some conditions presents a challenge to keeping a job (Savin, 2019; Solomon et al., 2014).
People with disabilities are often capable of productive activity. Many people with ADL difficulties (more than one-third of our research sample) were caregivers for others. The problem may be less an inability to work than an inability to meet workplace expectations of consistency, to be on call, or to travel to the workplace. People are expected to fit into the system. For example, beneficiaries in a California study expressed the desire to work and improve their situations, but some had already used up their Ticket to Work eligibility. Others wanted to attend college, which was seen as more flexible than the labor market (Savin, 2019).
The SSDI and SSI programs use a strict yes-or-no definition of disability: fully disabled or not at all. This binary approach doesn’t reflect the real, often fluctuating nature of disability and can create barriers for people whose conditions fall between these extremes. More flexible models that recognize partial or temporary disability and allow for continued work alongside receiving benefits, and higher asset limits, could better support individuals’ needs and promote their financial and personal well-being (Maestas, 2019; Yin, 2015).
Short-term disability programs—perhaps state-run—could be nimbler and more flexible, providing cash, health coverage, and caregiver support during the application period. Programs could partner with colleges and provide job placement services so that beneficiaries—even those in their 50s and 60s—have a chance not just to survive but to improve their situation (Savin, 2019).
Conclusion: Toward Stronger Supports for Disabled Workers and Their Families
The structure of Social Security disability programs, and state or nonprofit programs that work alongside them, could mitigate or contribute to midlife disparities in health and economic security. Rather than feeling like a safety net, SSI may mirror the precarity of the labor market for the most disadvantaged workers. Individuals with disabilities and their families find ways to meet some of their care needs, including with support from Medicaid, but their situations remain insecure. To develop ways to improve or supplement the programs and invest in Americans with disabilities, it is important to learn about and consider their lived realities.
Acknowledgment
The research reported herein was derived in whole or in part from research activities performed pursuant to a grant from the U.S. Social Security Administration (SSA) funded through the New York Retirement and Disability Research Center. The opinions and conclusions expressed are solely those of the authors and do not represent the opinions or policy of SSA, any agency of the federal government, or Hunter College. Neither the United States Government nor any agency thereof, nor any of their employees, make any warranty, express or implied, or assumes any legal liability or responsibility for the accuracy, completeness, or usefulness of the contents of this report. Reference herein to any specific commercial product, process or service by trade name, trademark, manufacturer, or otherwise does not necessarily constitute or imply endorsement, recommendation, or favoring by the United States Government or any agency thereof.
Jennie Kaufman, MPH, is a senior research associate at the Brookdale Center for Healthy Aging at Hunter College, City University of New York (CUNY). Na Yin, PhD, is an associate professor at the Marxe School of Public and International Affairs at Baruch College, co-director of New York Retirement and Disability Research Center, and a faculty associate at CUNY Institute for Demographic Research, in New York City.
Photo credit: Shutterstock/Kateryna Mukhina
References
Carr, D. (2019). Golden years? Social inequality in later life. Russell Sage Foundation.
Chidambaram, P., & Burns, A. (2024, July 8). 10 things about long-term services and supports (LTSS). KFF. https://www.kff.org/medicaid/issue-brief/10-things-about-long-term-services-and-supports-ltss/
Forden, J. and Ghilarducci, T. (2025). Medicaid Cuts Shift Long-Term Care Costs to Families. Schwartz Center for Economic Policy Analysis at The New School for Social Research’s Tracking the Retirement Crisis Policy Note Series. New York, NY.
Fry, R., & Aragão, C. (2025, March 4). Gender pay gap in U.S. has narrowed slightly over 2 decades. Pew Research Center. https://www.pewresearch.org/short-reads/2025/03/04/gender-pay-gap-in-us-has-narrowed-slightly-over-2-decades/
Goyat, R., Vyas, A., & Sambamoorthi, U. (2016). Racial/ethnic disparities in disability prevalence. Journal of Racial and Ethnic Health Disparities, 3, 635–645. DOI: 10.1007/s40615-015-0182-z
Herd, P., and Moynihan, D. (2025). Administrative burdens in the social safety net. Journal of Economic Perspectives 39(1), 129–150. DOI: 10.1257/jep.20231394
KFF. (2025). State health facts: Health status. https://www.kff.org/state-category/health-status/ssdi-ssi-beneficiaries/
Lee, S. (2020). Household responses to disability shocks: Spousal labor supply, caregiving, and disability insurance [Working paper series no. 21]. University of Waterloo, Canadian Labour Economics Forum. https://ideas.repec.org/p/zbw/clefwp/21.html
Livermore, G., Stapleton, D., & Claypool, H. (2009). Health Insurance and health care access before and after SSDI entry (No. 1255). Commonwealth Fund. https://ideas.repec.org//p/mpr/mprres/e650433d9c134b5e977c28c8606a1752.html
Maestas, N. (2019). Identifying work capacity and promoting work: A strategy for modernizing the SSDI program. Annals of the American Academy of Political and Social Science, 686(1), 93–120. DOI: 10.1177/0002716219882354
Maestas, N., Messel, M., & Truskinovsky, Y. (2024). Caregiving and labor supply: New evidence from administrative data. Journal of Labor Economics, 42(S1), S183–S218.
Rennane, S. (2020). A double safety net? Understanding interactions between disability benefits, formal assistance, and family support. Journal of Health Economics, 69, 102248. DOI: 10.1016/j.jhealeco.2019.102248
Satink, T., Josephsson, S., Zajec, J., Cup, E. H., de Swart, B. J., & Nijhuis-van der Sanden, M. W. (2016). Self-management develops through doing of everyday activities—A longitudinal qualitative study of stroke survivors during two years post-stroke. BMC Neurology, 16, 1–13. DOI: 10.1186/s12883-016-0739-4
Savin, K. (2019). “Being on SSI is a full-time job”: How SSI and SSDI beneficiaries work around and within labor incentive programs [Working paper]. https://scholarlycommons.pacific.edu/shs-all/506
Social Security Administration. (2018). National beneficiary survey: Disability statistics, 2015. https://www.ssa.gov/policy/docs/statcomps/nbs/2015/nbs-statistics-2015.pdf
Social Security Administration. (2025). Understanding Supplemental Security Income reporting responsibilities—2024 edition. https://www.ssa.gov/ssi/text-report-ussi.htm
Solomon, P., O’Brien, K., Wilkins, S., & Gervais, N. (2014). Aging with HIV: A model of disability. Journal of the International Association of Providers of AIDS Care (JIAPAC), 13(6), 519–525. DOI: 10.1177/2325957414547431
Women’s Bureau (2024). Median annual earnings by sex, race and Hispanic ethnicity. U.S. Department of Labor. https://www.dol.gov/agencies/wb/data/earnings/median-annual-sex-race-hispanic-ethnicity
Yin, N. (2015). Partial benefits in the Social Security Disability Insurance Program. Journal of Risk and Insurance, 82(2), 463–504. DOI: 10.1111/jori.12028


