


Abstract
Although older adults have made significant financial gains over the past generation, many experience economic hardship. In 2017, 14 percent of adults ages 65 and older had incomes below 125 percent of the federal poverty level, and 37 percent had incomes below 250 percent of that level. Low-income elders have little wealth to help meet spending needs dominated by housing and healthcare costs. These financial challenges limit housing options, especially for older adults who develop health or memory problems that limit their ability to live independently.
Key Words
retirement security, income, wealth, poverty, long-term services and supports, supportive housing
Housing and financial resources are closely intertwined. Most U.S. families build wealth through homeownership, and home equity represents the bulk of household wealth for middle-income families. As people age, they can tap into the wealth that has accumulated in their home through home equity loans, mortgage refinancing, and reverse mortgages. They also can downsize and devote some home sale proceeds to non-housing needs.
Financial resources also help elders determine the affordability of available housing options. Home modifications that allow older people to age in place if deteriorating health impairs their mobility can require significant financial resources. Other residential options, such as senior communities, continuing care retirement communities, independent living, assisted living, and nursing homes, also are expensive. A lack of financial resources can limit these options.
This article assesses financial well-being at older ages and its implications for housing options in retirement. It first describes how the share of older adults with limited income varies by demographic characteristics and how income in older age reflects earnings at younger ages. It then discusses household wealth and spending, particularly expenditures on medical care and long-term services and supports. The article’s conclusion describes the outlook for older adults’ financial security and implications for housing options.
Economic Hardship at Older Ages
Older adults have made significant financial gains over the past generation. Between 1966 and 2018, the official poverty rate for adults ages 65 and older fell from 29 percent to 10 percent, a nearly two-thirds reduction (Semega et al., 2019). These income improvements came almost entirely from rapid growth in Social Security benefits, as in the 1970s the program became more generous and more older people spent much of their working lives in Social Security–covered employment (Engelhardt and Gruber, 2006).
Despite the dramatic drop in the official poverty rate, many older adults continue to experience economic hardship. The 10 percent rate implies that 5.1 million Americans ages 65 and older live in poverty (Semega et al., 2019). Because the official poverty rate does not account for older adults’ relatively high out-of-pocket medical spending, many more older adults lack enough income to meet their needs.
‘5.1 million Americans ages 65 and older live in poverty.’
The U.S. Census Bureau recently developed an alternative calculation, the supplemental poverty measure, which better gauges the number of families with inadequate incomes (Fox, 2019). Like the official measure, the supplemental poverty measure identifies families whose incomes fall below a specified needs threshold. But it expands the cash income measure to include non-cash benefits, such as supplemental nutritional assistance and housing subsidies. It also subtracts out-of-pocket medical expenses, work expenses, paid child support, and taxes, while adding the earned income tax credit and other tax credits.
The supplemental poverty measure reveals that more adults, but fewer children, live in families with inadequate incomes than is shown by the official rate. Compared with the official measure, the supplemental poverty measure reduces the poverty rate for children 3 percentage points, to 14 percent, and increases the poverty rate for adults ages 65 and older 4 percentage points, to 14 percent. This improved measure indicates that 7.2 million people ages 65 and older were impoverished in 2018.
The share of the older population with cash incomes below 125 percent of the official federal poverty level (FPL) is about the same as the share in poverty under the supplemental measure. Thus, comparing income to 125 percent of FPL, which can be done easily using household survey data, indicates how economic hardship varies across the older population. In 2019, 125 percent of FPL corresponded to a household income of $15,327 for a single adult age 65 or older and $19,316 for an older couple.
Data from the American Community Survey, a large annual survey of U.S. households, show that in 2017, 14 percent of adults ages 65 and older had incomes below 125 percent of FPL (see Figure 1, below). Economic hardship is more prevalent among certain groups within the older population, such as African Americans, Latinos, individuals who did not complete high school, and widowed, divorced, and never-married adults. The prevalence of economic hardship among older adults increases with age; 18 percent of adults ages 85 and older had incomes below 125 percent of FPL, compared with only 13 percent of adults ages 65 to 74. Older adults with disabilities (disability here being defined as having difficulty living independently) also are more likely to have inadequate incomes than those without disabilities.
Figure 1: Percentage of Adults Ages 65 and Older with Limited Income, 2017

Source: Author’s estimates from the 2018 American Community Survey.
Note: The sample is restricted to adults living in the community, not in nursing homes. FPL is federal poverty level.
Because the FPL is low, many older adults with incomes that exceed 125 percent of FPL may also struggle to meet their spending needs. Thus, it is instructive to examine the broader group of older adults with incomes below 250 percent of FPL, which in 2019 was $30,653 for a single older adult and $38,633 for an older couple.
Overall, in 2017, 37 percent of adults ages 65 and older had incomes below 250 percent of FPL. The share reached or exceeded 50 percent among African Americans, Latinos, individuals who did not complete high school, people with disabilities, and widowed, divorced, and never-married adults. Women are much more likely than men to have incomes that fall short of 250 percent of FPL.
Divorce and widowhood often increase economic hardship in older age because people generally forfeit at least some of their spouse’s income when their marriage ends. Although Social Security survivor benefits provide some financial protection to widowed adults, the surviving spouse receives only between one-half and two-thirds of the monthly benefit that the couple received when both were alive. Most employer pensions continue making payments to surviving spouses, but remaining spouses usually receive only half as much as the couple had received when both spouses were alive. Spending needs as defined by the FPL fall by only about one-fifth when one spouse in a couple dies, so these income declines push many widows and widowers into poverty.
Groups with the highest rates of economic hardship at older ages generally earned less during their working lives than did those with more financial security. On average, people of color earn less than non-Hispanic whites, women earn less than men, and less-educated workers earn less than those with more education (Gould, 2019). Those who retired 20 or more years ago, who are generally the oldest old, earned less (even after adjusting for inflation) than those who retired in the past few years, because productivity grows over time and raises earnings. In addition, older people with difficulty completing basic personal care activities generally earned less than those who can live independently because they are more likely to be in their 80s or 90s, and to have limited education.
Income sources at older ages
Earnings differences lead to income disparities at older ages because retirement incomes mostly depend upon how much people earned during their working years. Monthly Social Security benefits are based on the average indexed monthly earnings received in covered employment during a retiree’s highest earning thirty-five years. The benefit formula increases retirement payments as lifetime earnings grow, but at a diminishing rate. Higher earners receive more Social Security payments than lower earners, but those payments replace a larger share of lifetime earnings for retirees with relatively low lifetime earnings. The average 2020 monthly Social Security retirement benefit is $1,460 (Social Security Administration, 2020).
Overall, Social Security benefits account for about half of the income received by adults ages 65 and older, and for about three-quarters of the income received by those in the bottom third of the income distribution (Bee and Mitchell, 2017).
Most retirees receiving small Social Security checks worked fewer than thirty-five years, often because of health problems or childcare responsibilities, although some worked many years at low wages (Favreault, 2010). Other retirees receive limited Social Security benefits because they collected their benefits early. Retirees receive their full retirement benefit each month until they die, if they begin collecting at the full retirement age (and they can receive a monthly bonus if they wait longer to begin collecting).
‘Divorce and widowhood often increase economic hardship in old age.’
The full retirement age is increasing from age 65 for people born before 1938 to age 67 for those born after 1959. Retirees may begin collecting benefits as early as age 62, but Social Security permanently reduces the monthly benefits received if retirees begin collecting benefits before their full retirement age. Many workers with limited education begin collecting benefits early, often because they have health problems or because their jobs are physically demanding (Haaga and Johnson, 2012).
Proceeds from retirement accounts, including employer-sponsored 401(k)-type plans, and income from investments and employer pensions account for another third of the overall income received by older adults (Bee and Mitchell, 2017). However, these sources make up only slightly more than one-tenth of the income received by older adults in the bottom third of the income distribution. Few low-wage workers can accumulate enough savings to generate substantial interest and dividend income at older ages.
In 2019, only 71 percent of workers had access to a retirement plan at their workplace, and only 56 percent participated in one, including 66 percent of full-time workers and 24 percent of part-time workers (U.S. Bureau of Labor Statistics, 2019). Coverage rates are much lower for low-wage workers. Only 46 percent of the bottom fourth of wage earners have access to a workplace-based retirement account, and only 27 percent participate in one. Because high-earning workers can amass substantial retirement savings, income is less equally distributed at older ages than at younger ages, despite the leveling effects of Social Security’s progressive benefit formula (Crystal, Shea, and Reyes, 2017).
Some older adults work for pay and receive labor-market earnings. Overall, earnings account for 14 percent of the income received by adults ages 65 and older, but they account for only 3 percent of the income received by older adults in the bottom third of the income distribution (Bee and Mitchell, 2017). College graduates are about twice as likely as those who did not attend college to work after age 65 (Johnson and Wang, 2017), mostly because they have relatively strong health and are employed in less physically demanding jobs (Johnson and Karamcheva, 2017).
Household Wealth at Older Ages
Most older adults with limited income have little household wealth they can use to help meet their spending needs. Data from the Health and Retirement Study, a large survey of older Americans conducted by the University of Michigan, show that median household wealth, which includes home equity, financial assets, the value of any businesses, and other real assets, in 2016 was $243,500 for adults ages 65 and older (see Figure 2, below). However, it was much lower among older adults with limited income, reaching only $116,000 for those with income between 125 and 249 percent of FPL and $28,000 for those with income below 125 percent of FPL.
Much household wealth, moreover, is held in real assets, such as housing, that are difficult to liquidate. In 2016, median financial wealth, which includes bank account balances, mutual funds, stocks, bonds, and other financial instruments, was only $50,000 for all adults ages 65 and older, $8,000 for those with income between 125 and 249 percent of FPL, and $50 for those with income below 125 percent of FPL.
Figure 2. Median Household Wealth of Adults Ages 65 and Older, 2016
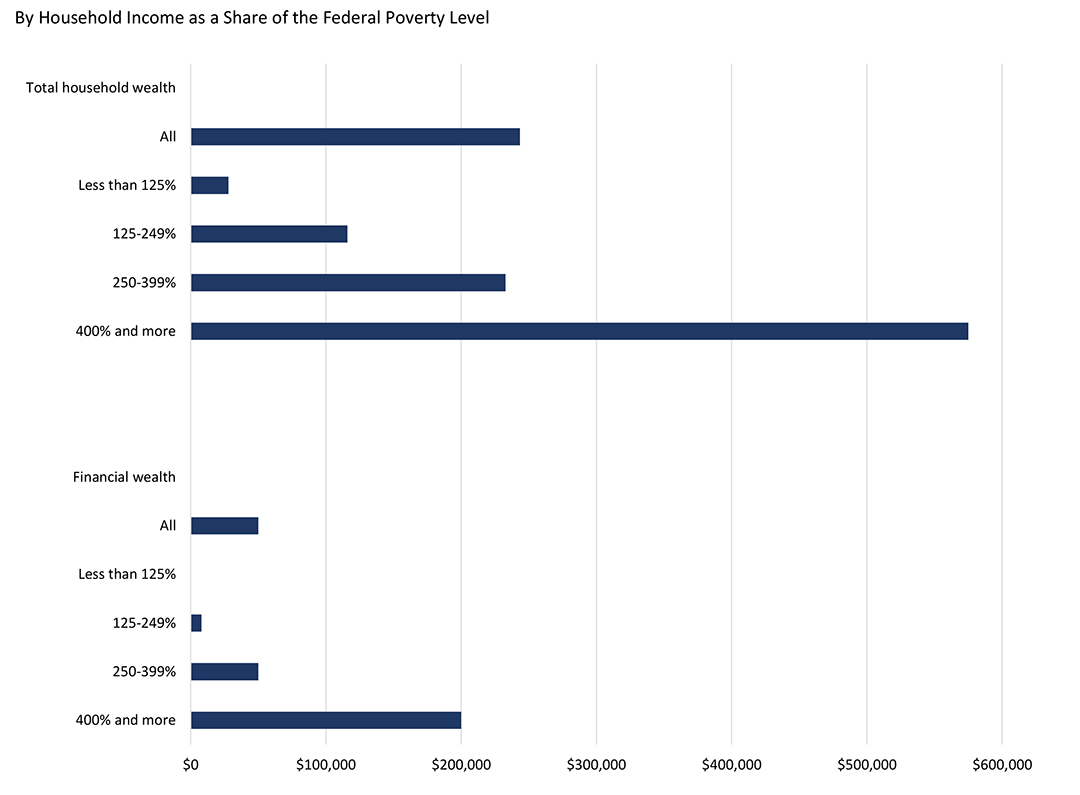
Source: Author’s computations from the 2016 Health and Retirement Study.
Note: The sample is restricted to adults living in the community, not in nursing homes.
Household Spending at Older Ages
Older adults spend more on housing than on any other type of expenditure. Housing expenses, which include rent, mortgage interest and charges, property taxes, home maintenance and repairs, homeowner and renter insurance, and utilities, account for 28 percent of spending by households headed by adults ages 65 and older (Johnson, 2015). About half of older households own a home free and clear (Butrica and Mudrazija, 2016). Housing expenses are substantially higher for the roughly one-quarter of older households that own their home but are paying off a mortgage, and the other quarter that rent their home.
Healthcare is another significant expense for older adults, who receive more services than younger adults. Medicare helps to pay for much of the medical care received by adults ages 65 and older, but most beneficiaries pay substantial premiums for physician services and prescription drug coverage. Medicare also requires beneficiaries to share the cost of most services, does not cap annual out-of-pocket payments, and excludes some important services, such as long-term services and supports and routine dental and vision care. As a result, households headed by adults ages 65 and older spend about twice as much of their income on healthcare as do households headed by adults younger than age 65 (Johnson, 2015). In 2016, Medicare beneficiaries averaged $5,500 in out-of-pocket healthcare costs (Cubanski et al., 2019). Out-of-pocket spending grows sharply with age; average costs increase from $5,000 at ages 65 to 74, to $10,300 at ages 85 and older.
The single greatest financial risk that older people face is the possibility of developing disabilities and needing long-term services and supports, because this care is expensive and there are few financing options. The nationwide median cost of a year-long stay in a nursing home, in a semiprivate room, is $90,155; it is much higher in certain parts of the country (Genworth, 2019).
The nationwide median cost for an hour of homemaker services is $22.50, which translates to about $44,300 a year for someone who receives the median amount of 90 hours of services per month (Johnson and Wang, 2019). Generally, neither Medicare nor traditional health insurance pays for these services. Usually private long-term-care insurance pays, but only 11 percent of adults ages 65 and older have coverage (Johnson, 2016). As a result, many older people who need long-term services and supports first turn to unpaid family help. When that is not enough, they turn to paid homecare and then eventually enter a nursing home.
Older adults typically pay for homecare and nursing home stays out-of-pocket until their money runs out; then they go on Medicaid, which generally pays the entire cost, but requires enrollees to turn over nearly all of their income and assets. Johnson and Wang (2019) estimate that 74 percent of non-Medicaid community-dwelling adults ages 65 and older could fund at least two years of a moderate amount of paid homecare (90 hours per month) if they liquidated all of their assets, except for their home.
‘Only 46 percent of the bottom fourth of wage earners have access to a workplace-based retirement account.’
Homecare, however, is less affordable, for those most likely to need it, including older adults with significant disabilities, single adults, and those ages 85 and older. Only 57 percent of older adults with significant disabilities (who generally have less income and wealth than better-abled people, even years before disability onset) (Johnson 2017) have available resources to fund at least two years of moderate amounts of paid homecare.
Many older people are better able to afford assisted living than paid homecare because they could, in theory, devote all of their wealth to these expenses. Recipients of paid homecare need to cover housing and food expenses, whereas assisted living provides room and board. In addition, assisted living residents could use their housing wealth to cover the cost of long-term services and supports. Nearly nine in ten older adults have enough resources, including income and wealth, to pay for assisted living expenses for two years (Johnson and Wang, 2019).
The Financial Security Outlook and Implications for Housing Options
Although many older adults are financially secure and can easily meet their housing needs as they age, millions face economic challenges that strain their ability to cover housing costs. More older adults are struggling to pay home mortgages as people increasingly enter retirement with outstanding housing debt (Butrica and Karamcheva, 2018).
Rent consumes a large share of household income for many other older adults, especially when rental costs grow faster than the cost-of-living adjustments they receive from Social Security. Older adults who own their home free and clear must continue to pay property taxes, utilities, insurance, and maintenance—a particular concern for the many retirees who have been living in their homes for decades.
Financial challenges often intensify when older adults develop health or memory problems that limit their mobility and ability to live independently. As with out-of-pocket healthcare costs, a lack of financial resources can limit their housing options. Home modifications, such as widening doorways to accommodate walkers and wheelchairs, installing ramps and grab bars, and replacing bathtubs with walk-in showers, can promote independent living.
Homecare can also help older adults to remain in their homes. Residential care facilities, such as independent and assisted living, provide another important option for older adults. All of these alternatives are relatively expensive. Some older adults can dip into their savings to accommodate these expenses, but much of their wealth is tied up in their homes and hence difficult to access.
The next generation of retirees faces additional financial challenges that may further limit housing options at older ages. Social Security’s full retirement age is increasing, cutting payments for all new beneficiaries. Employer-sponsored defined-benefit pension plans, which guarantee retirees a lifetime stream of cash benefits, have largely been supplanted by 401(k)-type retirement plans. These newer plans, which, unfortunately, are not universally available, generate substantial retirement income only if workers make significant contributions to their accounts each pay period, invest the funds prudently, resist the temptation to dip into their accounts before they retire, and manage their funds wisely after they retire.
As people live longer, their retirement savings must last longer. But wages for the majority of male workers have stagnated over the past few decades, leaving fewer financial resources that can be set aside for retirement. Rising out-of-pocket spending on healthcare and long-term services and supports (Hatfield et al., 2018) mean that future retirees will need more resources to make ends meet.
The future of Medicare and Social Security poses additional risks. Medicare’s financing problems could force benefit cuts that raise retirees’ out-of-pocket healthcare costs. Social Security is expected to run out of funds in the next fifteen years (Board of Trustees of the Federal Old-Age and Survivors Insurance and Federal Disability Insurance Trust Funds, 2019), which will result in across-the-board benefit cuts of about 25 percent (unless policy makers raise program revenues), leading to more financial hardship at older ages—and further constraining elders’ housing options.
Richard W. Johnson, Ph.D., is a senior fellow in the Income and Benefits Policy Center at the Urban Institute, in Washington, D.C. He also directs the Institute’s program on retirement policy
References
Bee, A., and Mitchell, J. 2017. “Do Older Americans Have More Income than We Think?” SEHSD Working Paper #2017–39. Washington, DC: U.S. Census Bureau. tinyurl.com/yapakpqr. Retrieved February 5, 2020.
Board of Trustees of the Federal Old-Age and Survivors Insurance and Federal Disability Insurance Trust Funds. 2019. The 2019 Annual Report of the Board of Trustees of the Federal Old-Age and Survivors Insurance and Federal Disability Insurance Trust Funds. Washington, DC: U.S. Government Printing Office.
Butrica, B. A., and Karamcheva, N. S. 2018. “In Debt and Approaching Retirement: Claim Social Security or Work Longer?" AEA Papers and Proceedings 108: 401–6.
Butrica, B. A., and Mudrazija, S. 2016. Home Equity Patterns among Older American Households. Washington, DC: Urban Institute. tinyurl.com/uvkypc7. Retrieved March 20, 2020.
Crystal, S., Shea, D. G., and Reyes, A. 2017. “Cumulative Advantage, Cumulative Disadvantage, and Evolving Patterns of Late-Life Inequality.” The Gerontologist 57(5): 910–20.
Cubanski, J., et al. 2019. “How Much Do Medicare Beneficiaries Spend Out of Pocket on Health Care?” Washington, DC: Kaiser Family Foundation. tinyurl.com/qsjvtk5. Retrieved February 6, 2020.
Englehardt, G. V., and Gruber, J. 2006. “Social Security and the Evolution of Elderly Poverty.” In A. J. Auerbach et al., eds., Public Policy and the Income Distribution. New York: Russell Sage Foundation.
Favreault, M. M. 2010. “Why Do Some Workers Have Low Social Security Benefits?” Retirement Policy Program Discussion Paper 10–03. Washington, DC: Urban Institute. tinyurl.com/vc9yf6k. Retrieved February 6, 2020.
Fox, L. 2019. “The Supplemental Poverty Measure: 2018.” Current Population Report P60–268 (RV). Washington, DC: U.S. Census Bureau.
Genworth. 2019. Cost of Care Survey 2019. tinyurl.com/y39j2b67. Retrieved February 6, 2020.
Gould, E. 2019. The State of Working America: Wages 2018. Washington, DC: Economic Policy Institute. tinyurl.com/y5qb28cy. Retrieved February 6, 2020.
Haaga, O. G., and Johnson, R. W. 2012. “Social Security Claiming: Trends and Business Cycle Effects.” Retirement Policy Program Discussion Paper 12–01. Washington, DC: Urban Institute. tinyurl.com/wdjs5l8. Retrieved February 6, 2020.
Hatfield, L. A. 2018. “Modeling Health Care Spending Growth of Older Adults.” Health Services Research 53(1): 138–55.
Johnson, R. W. 2015. “Housing Costs and Financial Challenges for Low-Income Older Adults.” Washington, DC: Urban Institute. tinyurl.com/v4makkj. Retrieved February 5, 2020.
Johnson, R. W. 2016. “Who Is Covered by Private Long-Term-Care Insurance?” Washington, DC: Urban Institute. tinyurl.com/yxqklvdz. Retrieved February 6, 2020.
Johnson, R. W. 2017. Later-Life Household Wealth Before and After Disability Onset. Washington, DC: Urban Institute. tinyurl.com/wk8u7k9. Retrieved February 6, 2020.
Johnson, R. W., and Karamcheva, N. S. 2017. “What Explains Educational Disparities in Older Adults’ Propensity to Work?” Journal of Organizational Psychology 17(6): 91–111.
Johnson, R. W., and Wang, C. X. 2017. Educational Differences in Employment at Older Wages. Washington, DC: Urban Institute. tinyurl.com/sxlrrsr. Retrieved February 6, 2020.
Johnson, R. W., and Wang, C. X. 2019. “The Financial Burden of Paid Home Care on Older Adults: Oldest and Sickest Are Least Likely to Have Enough Income.” Health Affairs 38(6): 994–1002.
Semega, J., et al. 2019. Income and Poverty in the United States: 2018. Washington, DC: U.S. Census Bureau.
Social Security Administration. 2020. “Monthly Statistical Snapshot, February 2020.” Baltimore, MD: Social Security Administration. tinyurl.com/y2u7c8cz. Retrieved March 24, 2020.
U.S. Bureau of Labor Statistics. 2019. National Compensation Survey: Employee Benefits in the United States, March 2019. Washington, DC: U.S. Department of Labor. tinyurl.com/r6nq6as. Retrieved February 6, 2020.


